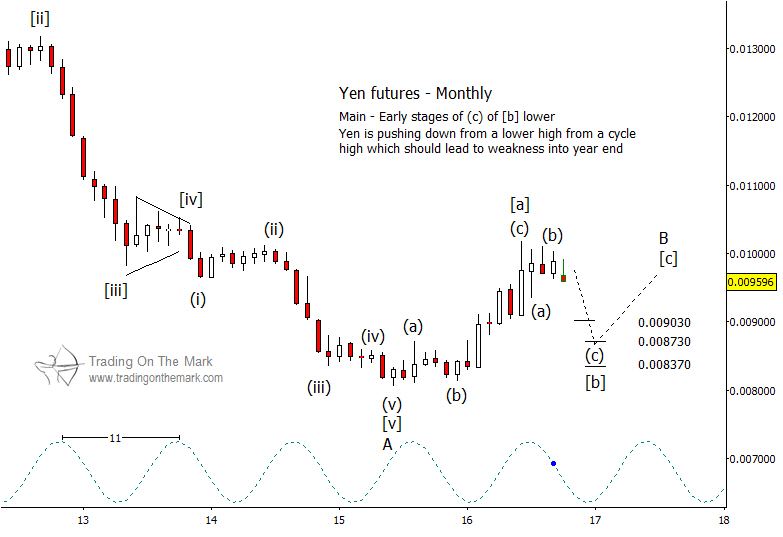
When we last wrote about Japanese Yen futures in late May 2016, we suggested a decline from the May/June cycle high would match our forecast for a downward drift into early 2017. Although the move has not yet built much downward momentum, there is now enough structure on a monthly chart and weekly chart (not shown) to project downward targets for the next leg of the pattern.
Our forecast is partly informed by our expectations for the value of the U.S. Dollar, which we believe should have a positive lean for the rest of 2016. In that environment, we do not expect the Yen to reach new highs above what it has already tested this year. A decline in the Yen would provide initial confirmation of the Elliott wave count shown on the chart below, which treats the move from 2015 to 2016 as upward corrective.
After the upward-corrective wave [a], it appears that price has traced the early parts of the next downward-corrective wave [b].
Since wave [b] should have three segments, it is possible to use Fibonacci relationships to project downward targets of the next segment, sub-wave (c) of [b]. A shallow retracement would take price near 0.009030, while an especially deep retrace could take it as low as 0.008370. The middle target at 0.008730 represents a 1×1 relationship and is the most probable area to watch for support that could initiate the next upward move.
The 11-month price cycle has worked fairly well for several years, and it predicts that the low of wave [b] should happen sometime near the turn of the year.
Traders who want to stay ahead of the turns this autumn can take advantage of our limited-time offer — a special 20% discount on all new subscription to our daily and intraday services. Claim your discount by using the coupon code 4FB2A when you follow the link on our subscription page.