
Sticking with our focus on currencies this month, we wanted to provide Trader Planet readers with an update on the U.S. Dollar Index. The nearby support area that we had identified on the chart posted in June
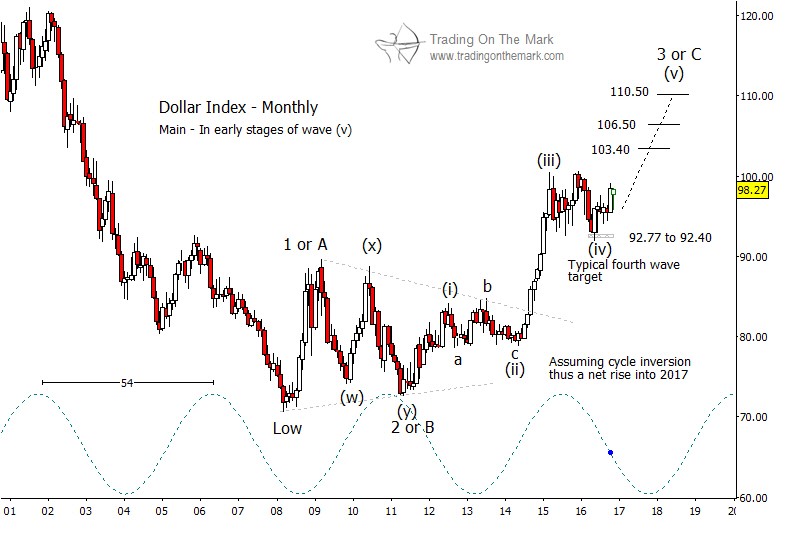
has held up well and has become the basis for a rally. If the rally continues, then the main upward targets we will be watching in 2017 and 2018 include 103.40, 106.50, and possibly 110.50.
Although we believe the corrective pattern of the last 20 months is probably complete, it is too early to be certain. On a monthly and weekly chart, it counts well as a completed fourth wave – part of what should be a larger five-wave sequence upward from the index’s 2011 low. However, the dominant 54-month cycle that fits the index is currently in a downward phase, suggesting there is at least a small possibility that the correction could take up more time by becoming more complex.
Going forward, a monthly close in the index above the 2015 high of 100.51 would provide initial confirmation that the current rally is accelerating. The structure of the next phase of the upward move should consist of five sub-waves, which may use the resistance targets mentioned earlier as “stepping stones” during its climb. We believe the price resistance levels will be more important than the 54-month cycle swing in finding the next DX high.
In addition, we would prefer to see DX remain above the support area that we have drawn near 92.40 and 92.77. A monthly close beneath that support in 2016 or early 2017 would suggest that the index could drift even lower before it eventually rallies.
There’s more! Our newsletter this month will focus on currency futures and related ETFs. Request your copy via this link!

