

When we last wrote about crude oil futures
in November, we suggested that price might be ready to embark on the next downward swing. Since that time, the consolidation pattern has not yet confirmed our expectations by breaking down, but the charts still show a favorable setup for crude oil bears.
The monthly chart below shows a revised Elliott wave count that we have moved to the forefront as our main scenario. We have assigned a higher-level fourth wave designation to the sideways-upward move which has persisted for the past year. We also are treating the decline from the 2013 high provisally as an ending diagonal pattern. Even so, the implications for the forecast in 2017 are quite similar to what we discussed in our earlier post.
Ideally, the present consolidation should remain beneath the lows of wave [i] at 62.13. However, a brief poke above that area would not invalidate the scenario. Potentially bearish traders should also watch the resistance offered by the channel harmonic line near 57.70, as it could initiate a renewed decline.
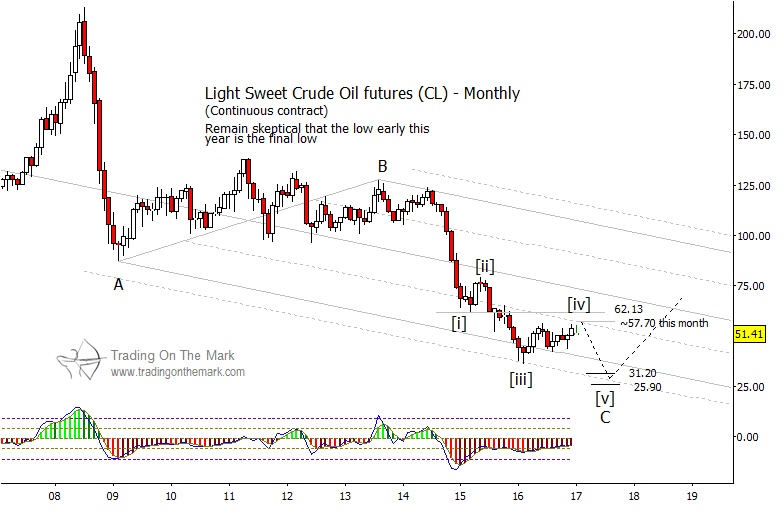
Key Fibonacci-related targets for a decline into new lows include 31.20 as a conservative target and 25.90 as a possible deep target.
If you’re an active trader, this type of charting we provide to our subscribers can be your guide to finding good entries and exits. New subscribers can get a full month of access to all the services we offer. This allows you to try our Daily Analysis and our Intraday Analysis for just the cost of the Daily Analysis alone. Give it a try, and see which service level works best for your trading style.

