

It was the first week of August last year when we suggested to readers here that gold had probably reached the end of the rally that had buoyed it since the start of 2016. At the time, we were using a chart of the SPDR Gold Trust (symbol GLD) to identify resistance, but the signs of a reversal were visible on the futures charts too. Soon after our post, futures began a decline that retraced about 75% of the whole rally.
If you’re an active trader, this type of charting can be your guide to finding good entries and exits. New subscribers get a full month of access to all the services we offer, including our Daily Analysis and our Intraday Analysis for just the cost of the Daily Analysis alone.
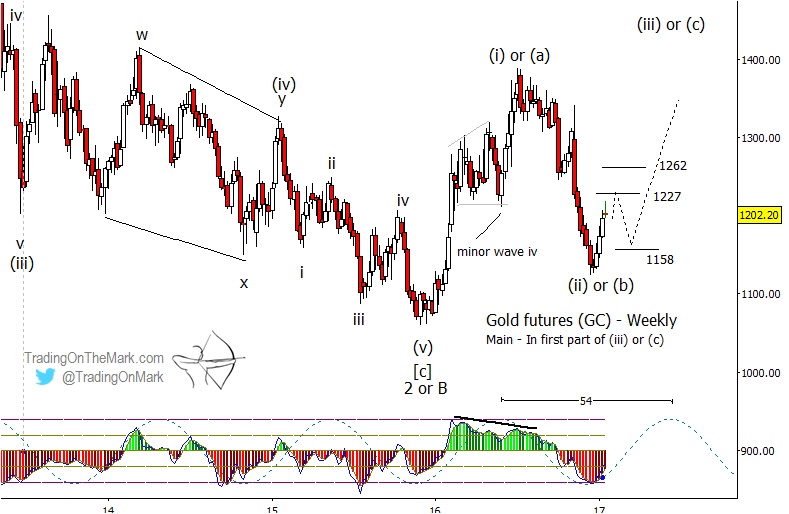
On the weekly futures chart, gold appears to have completed the downward phase of its current pattern. Although we cannot yet be certain whether the decline was wave (ii) of a five-wave impulse or wave (b) of a three-wave correction, the next stage should involve a fairly strong rally as either wave (iii) or wave (c).
For traders hunting long entries, it might be best to watch for a minor pullback first. Price is already near a Gann square-of-nine resistance level at 1227. If a downward retracement occurs this month or next month, then the area near 1158 appears attractive as potential support.
If price breaks above the nearby resistance, then 1262 represents the next upward target area. We have drawn the forward path on the chart to show futures testing the higher level after a pullback, but it is also possible to think of the level as a target if an upward breakout occurs prior to a pullback.
Note that the dominant 54-week cycle in futures price suggests an intermediate high might occur near the middle of 2017, perhaps around June or July. A pullback prior to that time could offer favorable conditions for long trades.

