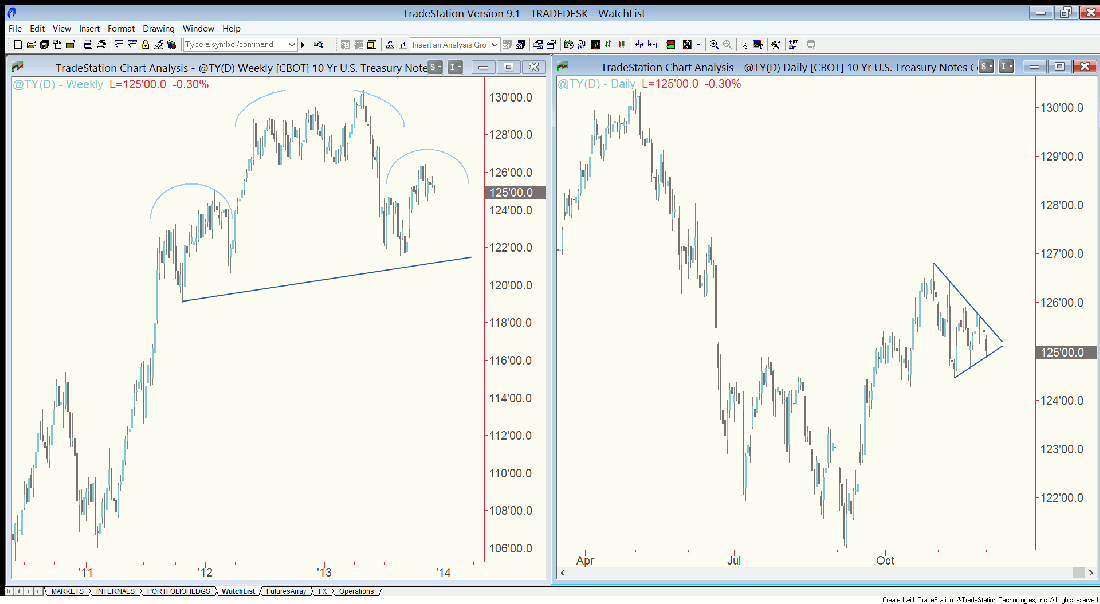
Good morning, all. Stock index futures continue a week of churning and I’m still more interested in what Treasury futures will do next.
Last week I highlighted the possibility of a head and shoulders top forming in the 10-year Treasury future since 2011. This morning I get more granular by looking at the price structure since the end of October. Specifically, a symmetrical triangle has formed, and price is getting close to the apex, which occurs in mid-December. That means we should see a resolution higher or lower by then. A breakdown from the triangle would elevate the odds of a right shoulder forming and thus support the case for lower prices in the intermediate term.

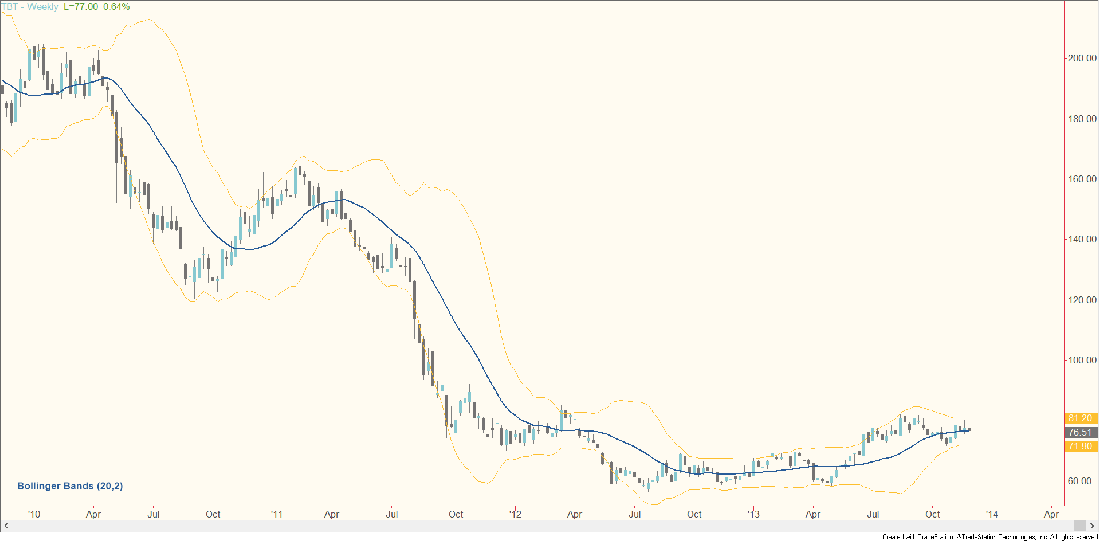
One way to trade this market is a long position in TBT (UltraShort 20+ Year Treasury Bond Fund), which is more liquidly traded than ETFs that pace the 10-year maturity. You can see on the weekly chart how the price structure shows what could be an inverse head and shoulders bottom – a mirror opposite to the head and shoulders top in the 10-year Treasury future. TBT has been trading around the weekly mean (20-week simple moving average) over the past three weeks, placing it at a natural point to begin its next move higher or lower soon. A stop loss could be placed beneath the 11/18 low of 75.41. If TBT indeed rallies, a trailing stop could be based on a downturn in the weekly mean, although it’s generally best to give a position trade some breathing room initially.

Good trading, everyone!
= = =
What’s your favorite trading book? Join the conversation on our Facebook page.
Learn more about Burba’s independent financial research here.


