

In this column on 10-29-12 I showed the relative chart of the Nikkei 225 versus the MSCI world index and explained how the breakout over a declining trendline, which was showing on the chart at that time, suggested great times ahead for the Japanese stock market. Since then the Nikkei has advanced 76%.
Looking at a monthly chart of the Nikkei we see it has advanced past the minimum expected move to 14,500 forecast by the bullish flag formation and has reached the descending trendline from the high in June, 1996 as well as the 76.4% retracement of the 2007 decline.
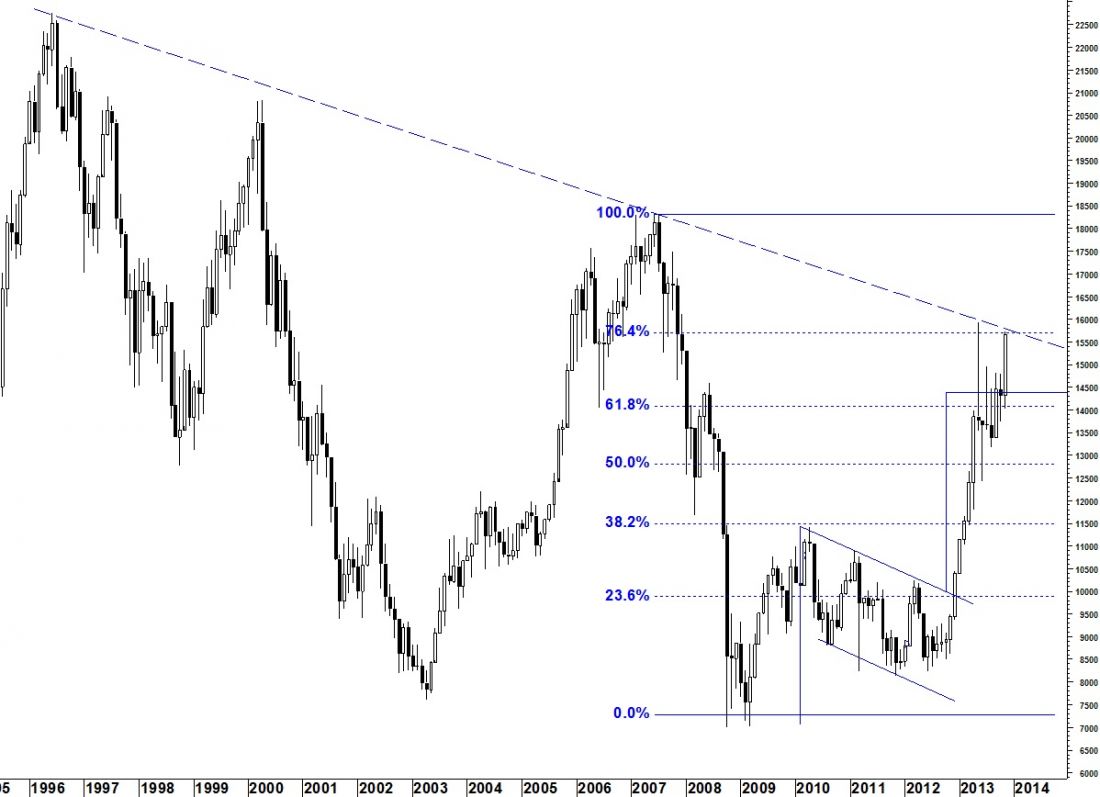
While a further move to the May high near 16,000 wouldn’t surprise me, the bull market of the last year may be finished and prudence calls for moving to the sidelines until NKX manages to exceed and hold these levels.
= = =
These weekly Commentaries are a snapshot in time. Opinions change and are updated continuously at the website. Try a trial subscription (“sneak-peek”) at Seattle Technical Advisors.

