– SPX 1225 was 161.8% expansion from previous swing with daily chart.
– EW is 61.8% / 161.8% Technique where third is longest (High propability scenarios start and end with these with all EW scenarios for safety secure).
– Stocks are passive to correct since this top has started to landing
– Additionally many previously long term bearish peoble turned to be bullish only with this expansion, that´s the psychology behind of W3 and EW also where W3 ends.
– SPX500 components as stocks (walked every single of them on last weekend), most have very short period bearish divergence as W3/W5 ie. higher high with price but lower low with Macd. (With long running time this kind of divergence would be disaster).
– EW expanding triangle (IV wave) after conditions where bullish daily chart contracting triangle were there in potential IV bullish positions to end 4:th, to respond fifth for it as upside which happened. This fifth wave was end of third one, with larger degree it could be even only first one in the full five wave sequence.
– Louds of papers arriving to 60 min chart timeframe W2 territory.
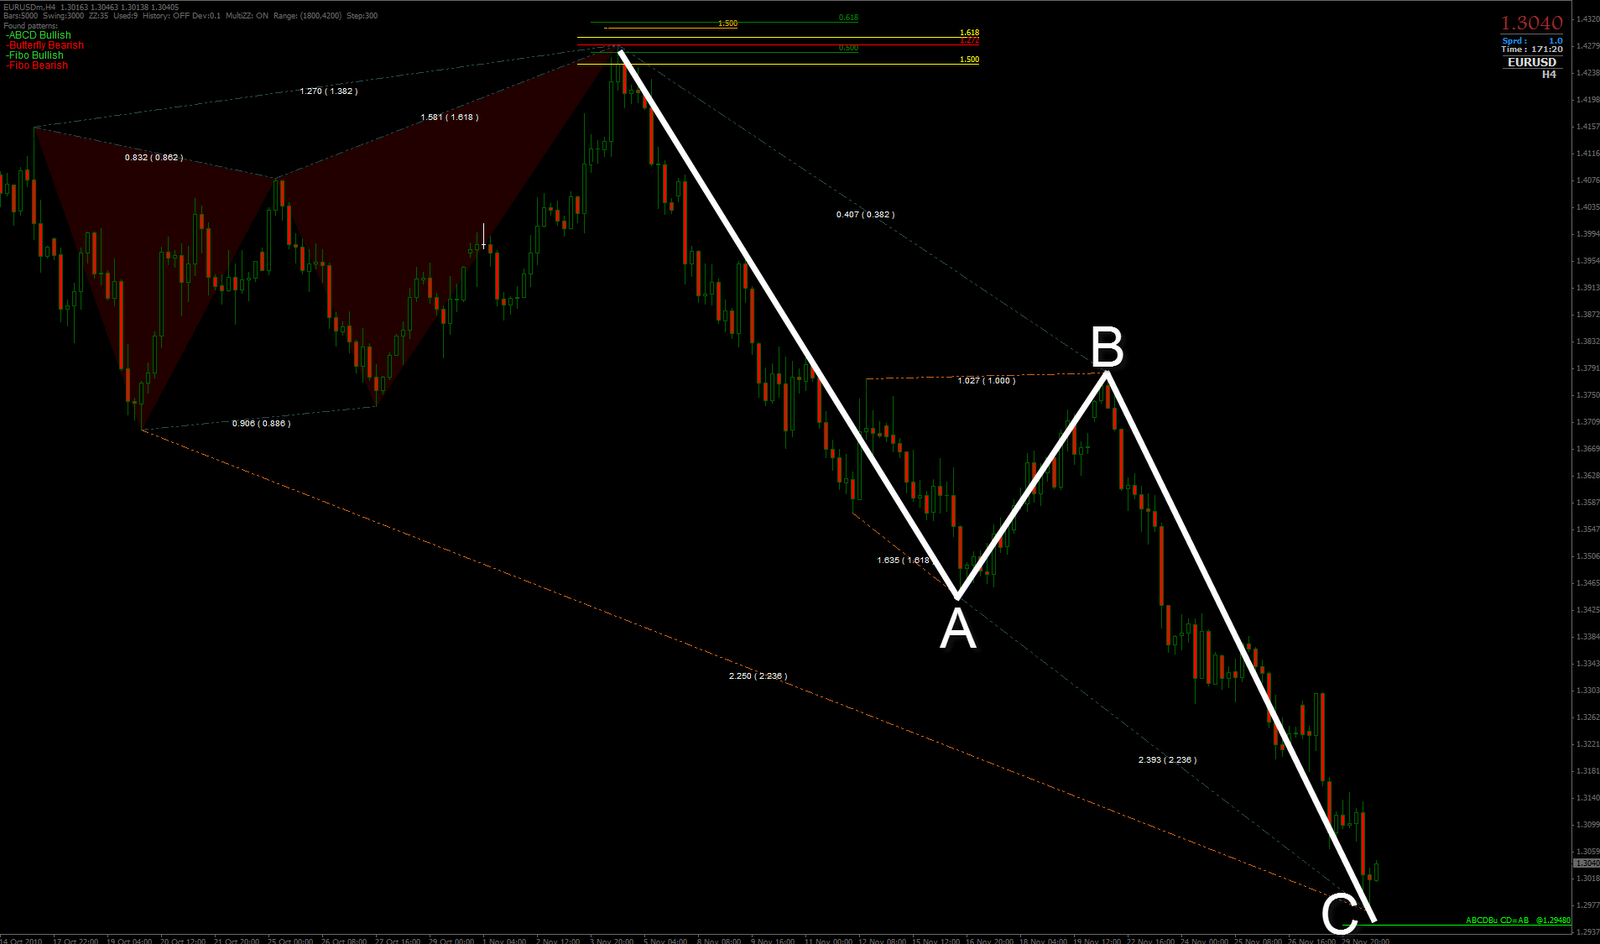
– Eur-Usd is very soon 5-3-5 in here (huge ABC).
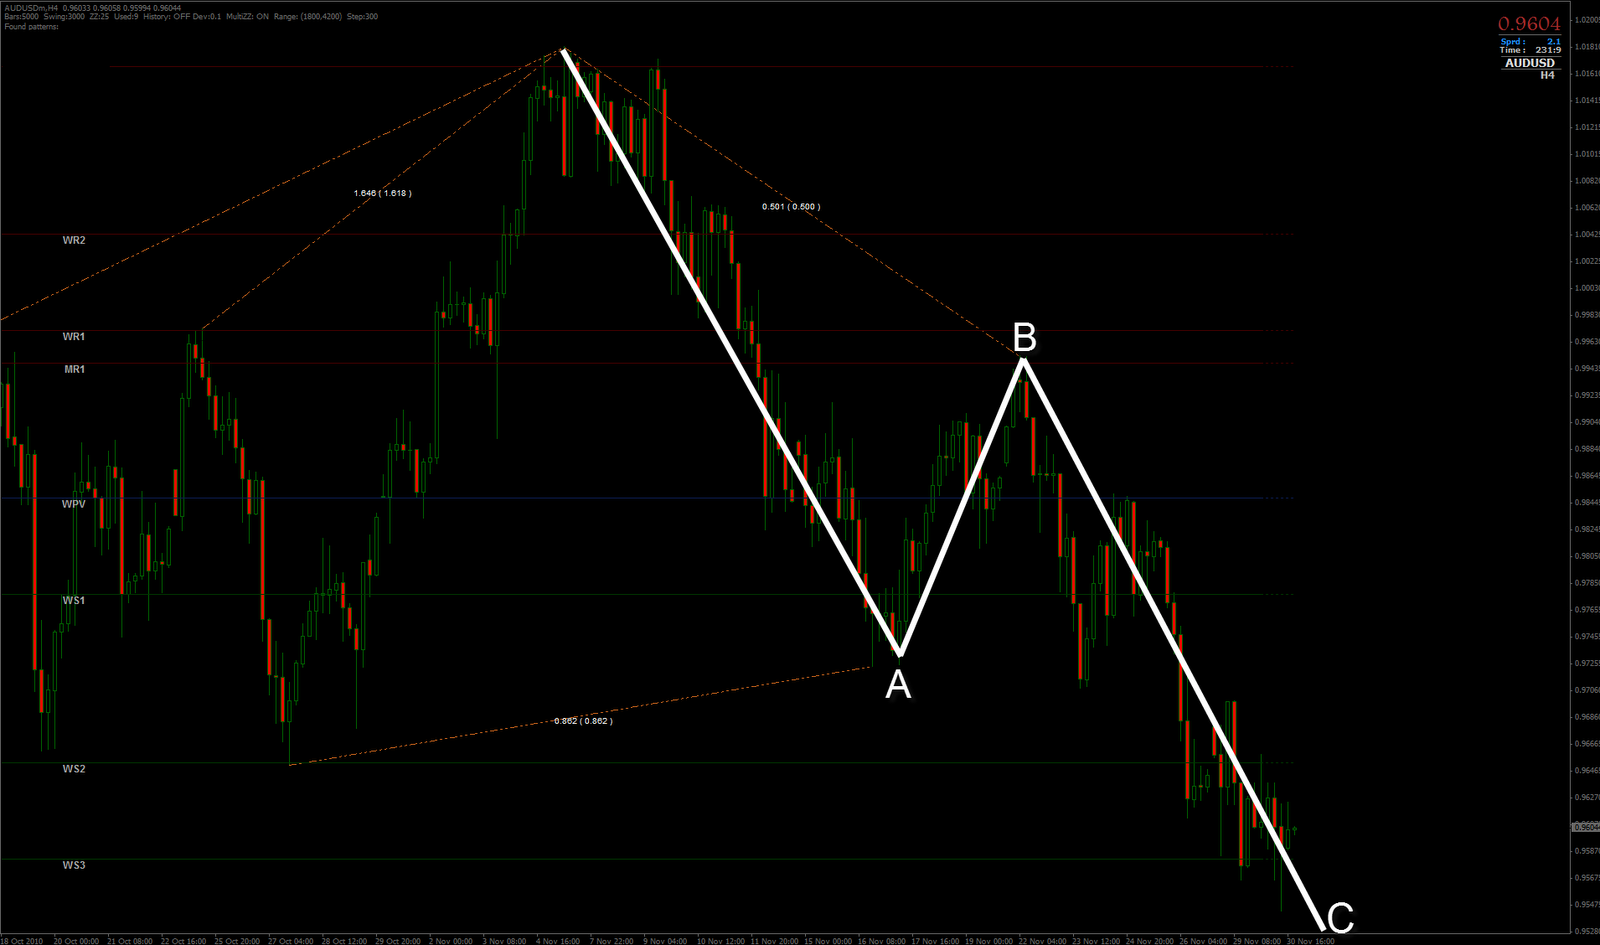
– Aud-Usd recent 3.142 W3 size with extended 1-2-1-2 condinitions allready (bearish daily crap).
With these reasons, I am in Caldaros camp – this is likely IV correction and that expanding triangle makes it in my chart like it has been doing for long allready.
Last E can become a bit more agressive with it but I don´t think it is here yet.
However, SPX has corrected from my yesterday SPX chart and it marked top for it again.
That largest speculated EW triangle is likely correct in it, SPX 1130-1150 and expanding triangles are heavily presented with IV waves. This exotic pattern in it is way or another related for that red D wave.
I didn´t short much anything with this downroll actually besides some Currency and SPX trades, on the other hand who the heck trades IV waves anyway ? Might do so actually for last E if I do find where it is going to change waves next time just because of “E” wave, in contracting triangle it is “nill” wave, in expanding triangle it is the most agressive and major one, but major interest to find actually potential ends with zigzag waves with stocks, for long side swings.
One another testimony about degree wave scenario like this is fight with currencies also, those EW flats for instance are often major IV waves (not directly related necessary for stockmarket but things cannot be under too big conflict with waves between the instruments and global index families) and nothing much contracting with them when waves do change just like that from one side to another (UsaCad, UsdChf, CadYen) are something which had done so recently.
Attatched the one reason why I do short in here also. ABC-x at least might be under work. Bullish divergence it idoes not have yet in here but that´s the reason why slightly reverse with currencies now after drop.
(Edit; Attatched possible Aud-Usd ABC also)