Last week’s World Agriculture Supply and Demand (WASD) report sent the soybean market screaming higher on news of tighter ending stocks for old crop, reduced production in Argentina and Brazil along with growing global demand. More importantly, this report came on the heels of what has already been one of the best bean rallies farmers have seen since the planting rally two years ago. The one-two punch of the southern hemisphere El Nino related weather problems in April followed by May’s WASD report has created a textbook blow-off pattern in the soybean market as first, the futures spiked and then the option market followed suit.
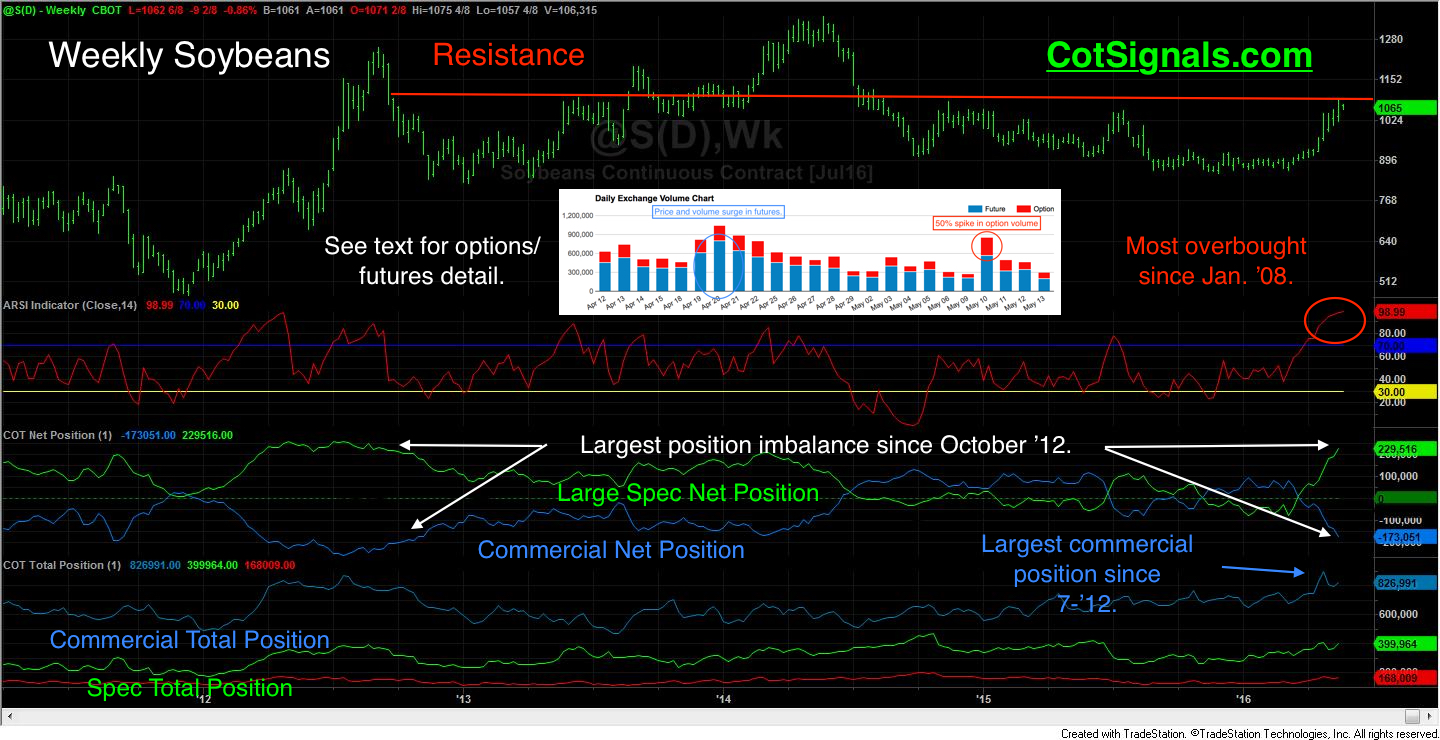
There are several key points to examine on the included chart. All of which lead to the same conclusion.
1) Farmers have been living with low prices for more than two years, now. In fact, the case is strengthening for excess beans in storage finally being marketed. This confirms the anecdotal evidence we discussed last month regarding soybean carryover.
2) The Illinois Department of Agriculture and Consumer Economics has pegged breakeven around $10.50 to slightly higher depending on the area.
3) This means farmers can finally generate some cash…which they’re doing partially, through the selling of options.
4) Commercial traders are the most bearish they’ve been since 2012.
5) Speculators are the most bullish they’ve been since 2012.
6) Both of the above statements are reflected in total size and net position.
7) Our momentum indicator is the most overbought it has been since President Obama took office.
Now, let’s discuss the specifics of the recent technical action in the soybean market. Note the inserted “Daily Exchange Volume” chart provided by the Chicago Mercantile Exchange. The soybean market had its first significant upwards thrust through previous resistance on April 20th, as it pushed through $9.50 per bushel. This rally was accompanied by significant futures volume. This is typical behavior of a breakout. The move through resistance brings trend followers to the market on the long side, while flushing out the losing short trades on the move through the resistance. Finally, our momentum indicator has reached its highest level since January of 2008 on a weekly basis.
Compare this to the move on May 10th based on the impetus provided from the WASD report. The action May 10th is decidedly more options based. In fact, the option market volume spiked by more than 50% on the 10th. Commercial traders (farmers) have taken advantage of this rally to lock in prices for grains in the bin as well as those in the field. Option action on May 10th was decidedly biased towards the put side. Total put volume nearly doubled the call volume. Historically, I’ve seen this happen several times. First, the futures blow off and then the options. This is highly indicative of market exhaustion.
The sequential blow off of the futures, followed by the options makes the following Commitments of Traders analysis even weightier. Commercial and speculative traders have reached the largest imbalance in positions since 2012. This is corroborated by their diametrically opposed net positions. It has been our experience that the larger the position imbalance between the speculators and the commercial traders, the bigger the pending reversal. We feel the overbought condition of the market momentum indicator is unsustainable. We’ll be looking for direct short entries upon the first clues of a reversal lower….like the growing bearish divergence on the daily chart.
We publish nightly discretionary and mechanical trading signals based on our Commitments of Traders analysis. Sign up today and have the soybean reversal signal sent straight to your email, once triggered.
Please go to CotSignals.com for more information our approach to trading.