

I noticed CF Industries Holdings (CF) was abuzz on StockTwits today.
CF announced earnings and after the report a really pretty bullish candle pattern appeared. The blue line is the 100 simple moving average. The red line is the 200 simple moving average.
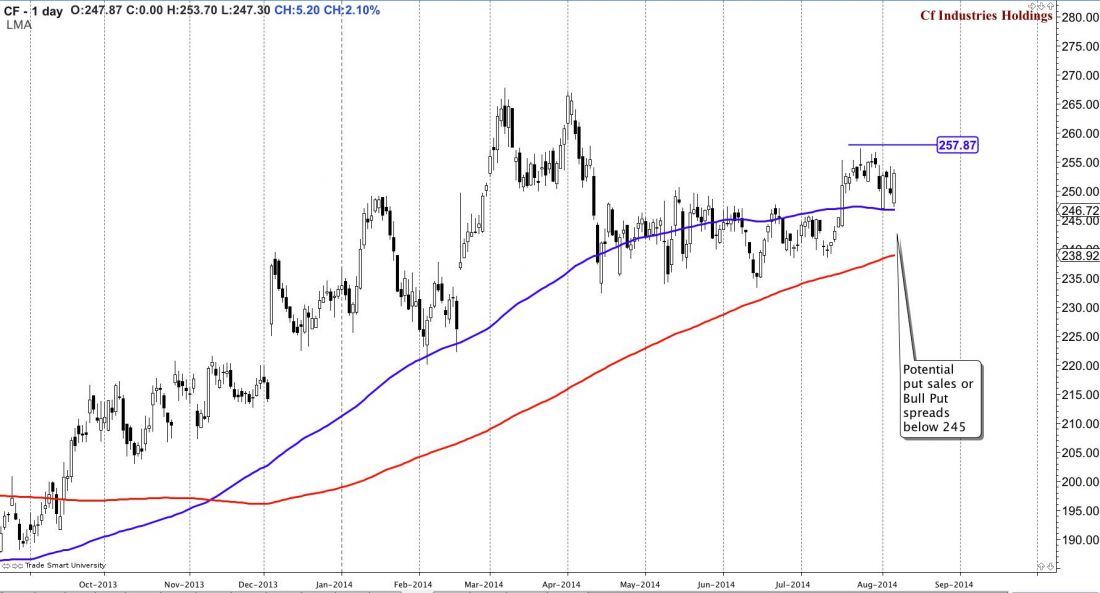
CF had a nice range and traded sideways from mid April to mid July. Then on 7/17/14, a strong bullish candle appeared and broke the resistance. At this point a nice, smooth retest of the breakout is occurring, with buyers using the 100 as a support.
Trend Outlook
Since the primary trend is bullish, intermediate trend is bullish to neutral, and minor trend is shaping up to be bullish to neutral, if the stock closes above 257.87 I would say all three levels of the trend are aligned at that point.
As stop could be placed with a close around 246. For traders who own more than 100 shares, a covered call could be sold once/if CF hits 265, prior resistance. Expect a small rest there for a few weeks to months.
Bottom Line
The analysis, candles and long term moving averages look strong. I think 8/7/14 and 8/8/14 will be very telling times on the market.

