
I am a big fan of eBay Inc. (EBAY) as a company. I haven’t sold too many things on there, but even so, I do wonder how much I could get for my 10-pound rubber ball made entirely of rubber bands. Probably wouldn’t get more than $10 for it, so I figured it’s not even worth my time. Plus, it’s a cool thing to show people at some point when they visit my house. But, I digress.
DISTRIBUTION PHASE
The stock EBAY has been in a distribution phase for over one year; actually pretty similar to what it did from January 2011 – January 2012, only this time it was January 2013 – January 2014. Carl Icahn is also an avid investor in EBAY at the moment and the technicals speak volumes as to what this stock could be setting up to do. I rarely look at a monthly chart, but this stock has been moving sideways for so long it does offer a nice perspective.
If you gaze at the 10, 20, and 50 exponential moving averages you’ll see a pretty slope to them. The stock traded down, only recently, to the 20 EMA and 20 SMA and bounced nicely with a long lower wick showing buying pressure. The Bollinger Bands® look delicious on a monthly perspective as well, with March already piercing the upper band showing strong, bullish strength. Other indicators like ADX and RSI show this bullish trend has plenty of momentum left. EBAY is currently trading near its all-time high, around the $59 price range. If it closes above the all-time high of 59.88 in the next few weeks or days, a bullish outlook would make the most sense.
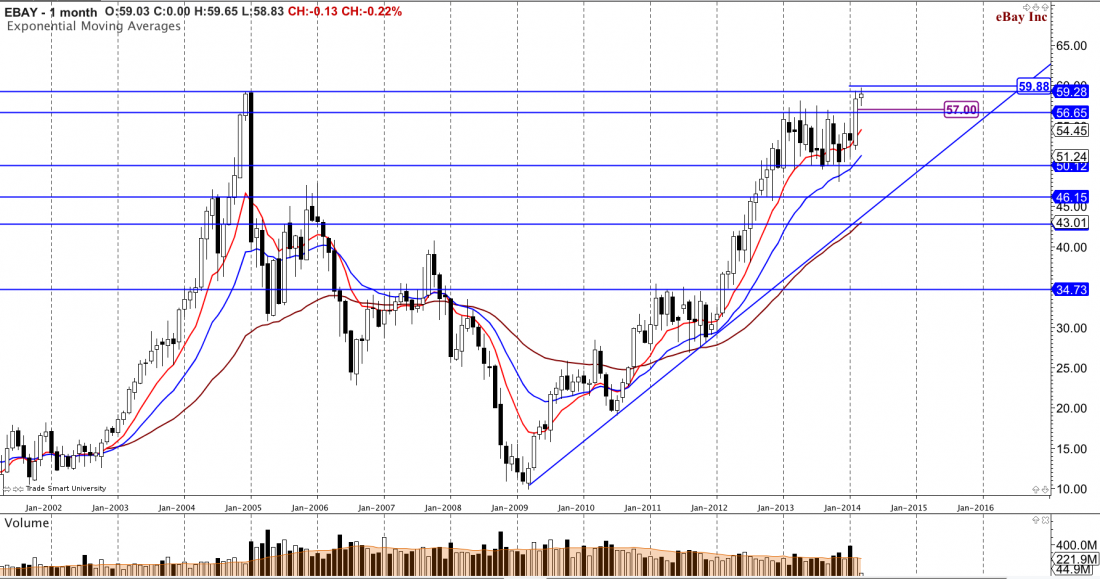
As far as stops and risk mitigation goes, since EBAY would be breaking out of a year-long distribution phase, you could expect the stock to potentially retest the current resistance as new support. This is because anyone who was holding EBAY shares back in 2007 and didn’t sell will FINALLY have an opportunity to make a profit on their shares! This often causes a retest. I think a $55 stop for the time being makes a lot of sense, being that $55 is under the 50 exponential moving average on the daily chart and at the 10 EMA on the weekly chart.
PRICE TARGETS
The targets on EBAY? Well, that’s the fun part! With as much consolidation as it’s had, this could and should be a longer term trade; four to five months at least. $70 is an obvious target using a Fibonacci extension and just plain ol’ big round numbers. However, using a weekly chart and the July 2012 – January 2013 wave extension, $74 is where I would exit most of my position on EBAY, looking for another location to re-enter. This is a 1:3 Risk/Reward ratio and would/could get better over time as we begin to raise our stop on this position. EBAY doesn’t pay dividends, but does have pretty decent premium for covered calls. This could be a fun ride. And if ‘Carl Icandy’, as I call him, is looking to get rich off this stock, I feel we should join him.
Trade your plan, folks, and mitigate your risk as always!

