

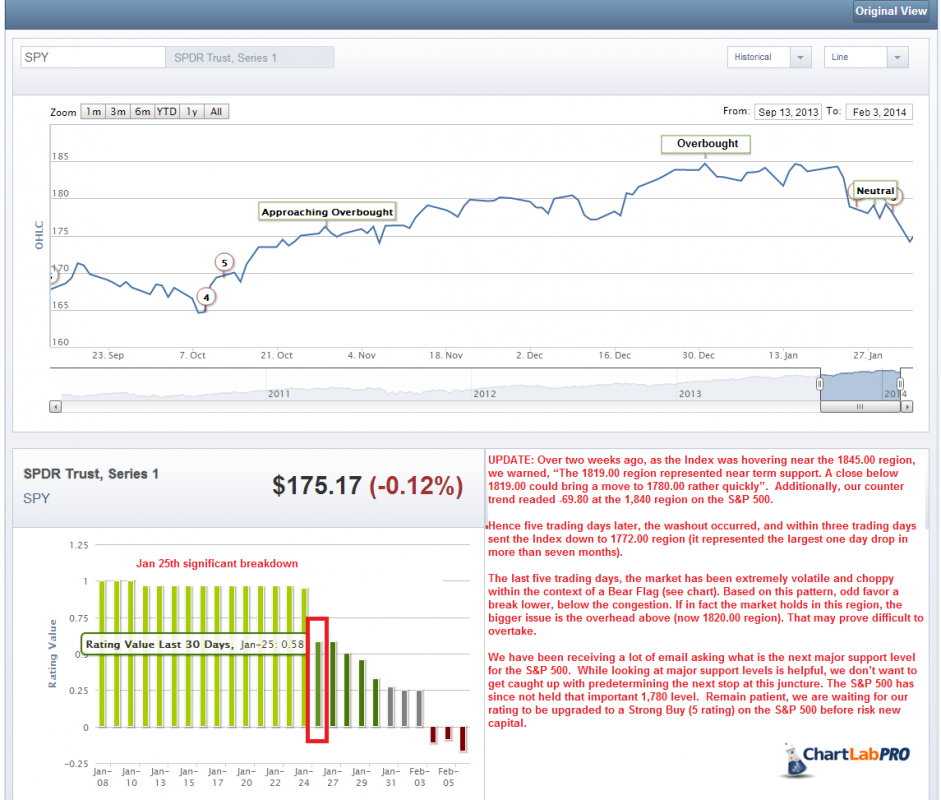
Over two weeks ago, as the S&P 500 index was hovering near the 1845.00 region, we warned, “The 1819.00 region represented near term support. A close below 1819.00 could bring a move to 1780.00 rather quickly”. Additionally, our counter trend readed -69.80 at the 1,840 region on the S&P 500.
Hence five trading days later, the washout occurred, and within three trading days sent the Index down to 1772.00 region (it represented the largest one day drop in more than seven months).
The last five trading days, the market has been extremely volatile and choppy within the context of a Bear Flag (see chart). Based on this pattern, odd favor a break lower, below the congestion. If in fact the market holds in this region, the bigger issue is the overhead above (now 1820.00 region). That may prove difficult to overtake.
We have been receiving a lot of email asking what is the next major support level for the S&P 500. While looking at major support levels is helpful, we don’t want to get caught up with predetermining the next stop at this juncture. The S&P 500 has since not held that important 1,780 level.
Remain patient, we are waiting for our rating to be upgraded to a Strong Buy (5 rating) on the S&P 500 before risk new capital.
= = =

