

My last article on TraderPlanet: The Fed And U.S. Stocks: Is It All A Shell Gamefocused on the discrepancy between financial market performances and real economy and it tried to detect how big the impact of central bank intervention really is. The examination proved that we are currently engaged in a poisoned market because the macroeconomic scenario definitely does not justify the strong uptrend in the equities.
This article will attempt to identify which macroeconomic indicator, in spite of the exogenous intrusion of central bankers, better tracks the performance of the core American index: the S&P 500.
E-MINI CORRELATIONS
The analysis consists of a simple yet strong correlation matrix showing the robustness of the relationship among E–Mini S&P 500 futures and 16 macroeconomic indicators. The indicators that have been selected are very popular but they also represent and describe the performances of different business aspects such as housing market, consumer behavior, industrial productivity and the general economy.
THE DATA
The macroeconomic indicators that will be examined are the following: Industrial Production, Philadelphia Fed Manufacturing Index, Non Farm Payrolls, Unemployment rate, Housing Index, Building Permits, Personal Spending, Personal Income, Inflation, Retail Sales, Business Confidence, Durable Goods Orders, Wages in Manufacturing, Car Registration, New York Empire State Manufacturing Index and New Home Sales (the data set consists of monthly data ranging from January 2012 until August 2013).
Take a look at the correlation matrix seen in Figure 1 below.
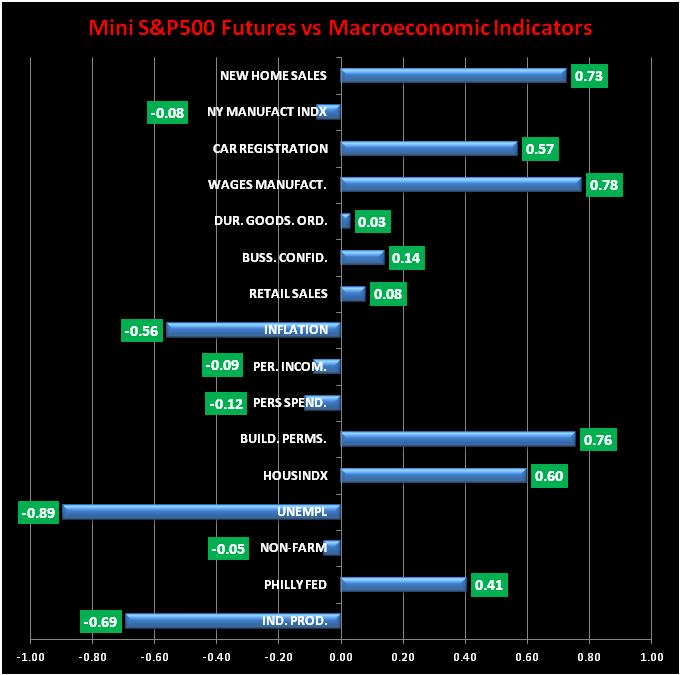
As you can clearly notice, some macroeconomic indicators have a solid connection with the S&P 500 and some others do not. Obviously, we want to know which ones can help us in forecasting or understanding the fluctuations of futures prices and volatility, hence, it does not matter if the relation is negative or positive; the only thing that matter is how strong the bond among the data sets is.
THE LOSERS
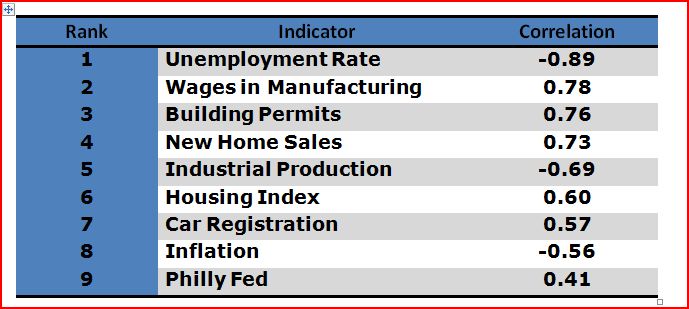
Let’s start our analysis by listing the macroeconomic indicators that proved to be inefficient. Durable Goods Orders (+0.03), Retail Sales (+0.08), New York Empire State Manufacturing Index (–0.08), Business Confidence (+0.14), Personal Income (–0.08), Personal Spending (–0.12) and Non–Farm Payrolls (–0.05) are all poor indicators because the correlation is rather weak. The fragile connection among these figures implies that, in the medium to long term, they do not follow, track or forecast very well E–Mini S&P 500 futures prices even though they might have a remarkable impact in the short term. Let’s now focus on the “good” ones, seen in Figure 2.
THE WINNERS
The unemployment rate is, by far, the best macroeconomic indicator since January 2012 so far. The correlation between futures prices and unemployment rate is very strong and its negative sign implies that all the time the jobless rate goes down, E–Mini S&P 500 futures edge higher and vice versa.
Wages in manufacturing (+0.78) are very important because every rise in workers’ wages is welcomed as a sign of recovery from investors, hence, the buying pressure increase. Building permits (+0.76) is another good indicator because the construction of new houses is perceived as sign of growth and consequentially the New Home Sales data (+0.73) play a significant role for the same reason. Industrial Production (–0.69), strangely enough, has a strong negative correlation and the reason the connection between E–Mini S&P500 futures and industrial output is inverse is only one: the intervention of the Federal Reserve.
The artificial injection of liquidity into the market rendered the American index immune to dangerous swings in industrial performances and that is precisely why the correlation between the aforementioned data is negative. Needless to say that the same rationale applies to Inflation (–0.56), in fact, the external and continuous interventions of the Fed were aimed also to counterbalance as much as possible the consequences of a deflationary or hyper inflated environment. Housing Index (+0.60), Car Registration (+0.57) and the Philly Fed Manufacturing Index (+0.41) ends the “good” ranking.
KEY TAKEAWAYS
Unemployment rate and Wages in Manufacturing are definitely the best macroeconomic indicators to study and observe when trading E–Mini S&P500 futures/options or S&P500 futures/options. In terms of business sectors, the best ones to monitor are the Housing and the Manufacturing markets. The reason the aforementioned sectors should be closely observed is that among the top 9 indicators, 3 of them are related to the housing market (Building Permits, New Home Sales and Housing Index) and another 3 tracks the performance of the Manufacturing industry (Wages in Manufacturing, Philly Fed and Car Registration. The car industry is just a sub–sector of the Manufacturing business).

