

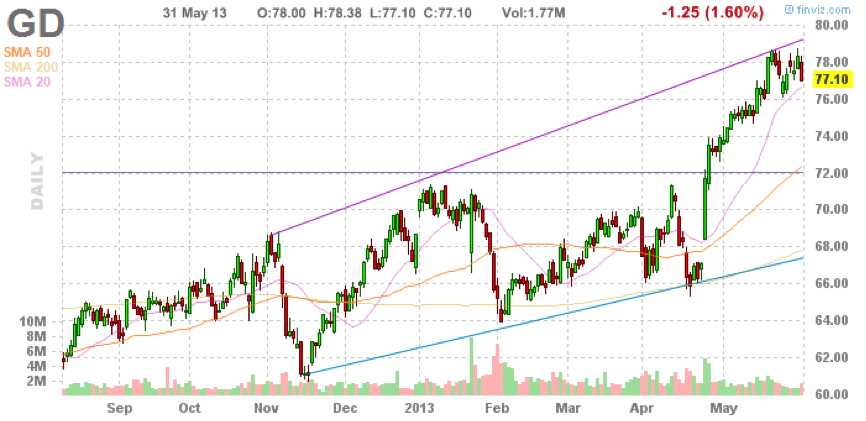
Over the past 30 days, General Dynamics Corp. (GD) has traded in a $66.05 – $78.76 range. Recently, the stock has been showing support around $71.30 and resistance in the $78.60 range. Though trading above the 50-Day Moving Average and 200-Day Moving Average, GD’s momentum and MACD indicators show short-term bearish movements.
A LOOK AT FUNDAMENTALS
General Dynamics’ short-term bearish technical indicators are also supported by weak fundamentals. GD’s first-quarter net income edged up about 1 percent, as lower operating costs offset a slight decrease in revenue. The company earned $571 million, or $1.62 per share, up $564 million, or $1.57 per share, from the same quarter the year before. A reduction in the number of outstanding shares from last year provided a 3-cent boost to the recent quarter’s per-share results. Revenue fell 2 percent to $7.4 billion from $7.58 billion. Combat systems revenue tumbled 19 percent to $1.55 billion, but was partially offset by a 10 percent increase in aerospace revenue to $1.78 billion. Operating costs and expenses fell 2 percent to $6.58 billion.
DEBIT PUT SPREAD
Technical and fundamental indicators both show a short-term bearish environment for GD. Investors should consider the following debit put spread: Buy July 2013 75.00 Puts at $1.60 and sell the July 2013 72.5 puts at $0.90.
The net debit to start is $0.70, and we recommend holding until spread price reaches $1.80.This strategy will allow you to collect time premium for out of the money short puts and decrease the overall cost of the initial investment.

