

While commodities in general haven’t had a great start to the year, cotton hasn’t been beaten up too badly.
Looking at the iPath Cotton ETF ($BAL), we can see cotton is just about flat on the year while the PowerShares Multi-Sector Agriculture ETF (DBA) is off nearly 9%. However, it hasn’t been all roses and sunshine for cotton this year.
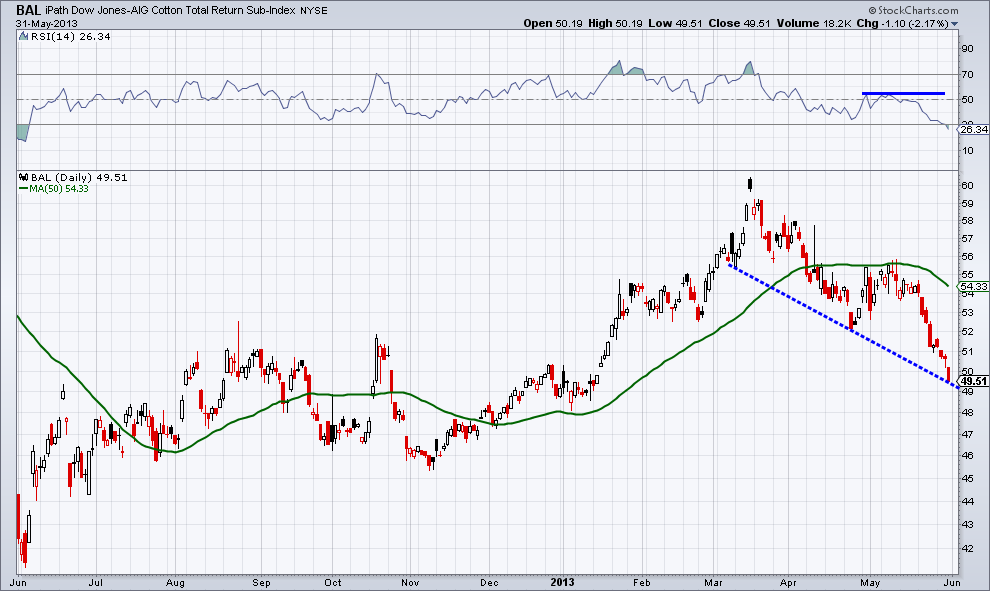
I wrote a post on my blog in March titled “Are the Sheep About to Get Sheared in Cotton?” – noting the bearish candlestick pattern as well as the fact that the commodity was up against a falling trend line didn’t bode well for further price appreciation. Going forward resistance held and $BAL fell 16% through Friday.
TECHNICAL OUTLOOK
Looking at the chart below, particularly the last few months, we can see that the Relative Strength Index was unable to regain a bullish level when $BAL attempted to test its 50-day moving average. While bullish traders attempted to push prices higher, momentum was not on their side and the moving average batted prices back down.
BOTTOM LINE
This lower low in April created a trend line that price butted up against with Friday’s close. With this test of the support we also have an oversold RSI indicator. A short-term bounce may be due for this struggling crop, although the bearish resistance in momentum needs to be dealt with before getting too cotton crazy.
Disclaimer: The information contained in this article should not be construed as investment advice, research, or an offer to buy or sell securities. Everything written here is meant for educational and entertainment purposes only. I or my affiliates may hold positions in securities mentioned.

