

Yesterday was a very important trading day for S&P 500 traders as they saw the large cap index close at a new record high. With all this euphoria in the air, it is important to remember that the last time we were at these vertigo levels was in 2007, pre-subprime crash.
Although the rise has been incredible the past 4 years, the truth is that we are unaware of how long this rally could last. There is no combination with the real economy here, as the markets have been pumped with strong liquidity injections (QE1, QE2, Operation Twist, QE3, etc.). These money printing measures have managed to control the historic crash we’ve seen in 2007-2008.
How far can this upswing take us?
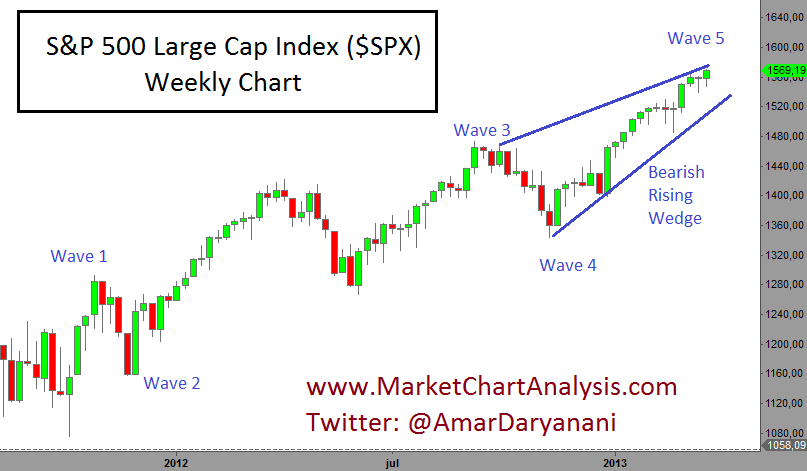
ELLIOTT WAVE SAYS “ENOUGH”
According to the Elliott Wave count, we should be reaching a possible top. Even though Wave 5 might push a bit higher, it is only a matter of time for a healthy and necessary correction to come our way.
A bearish Rising Wedge has also come into action, forecasting a possible turnaround in the price of SPX.
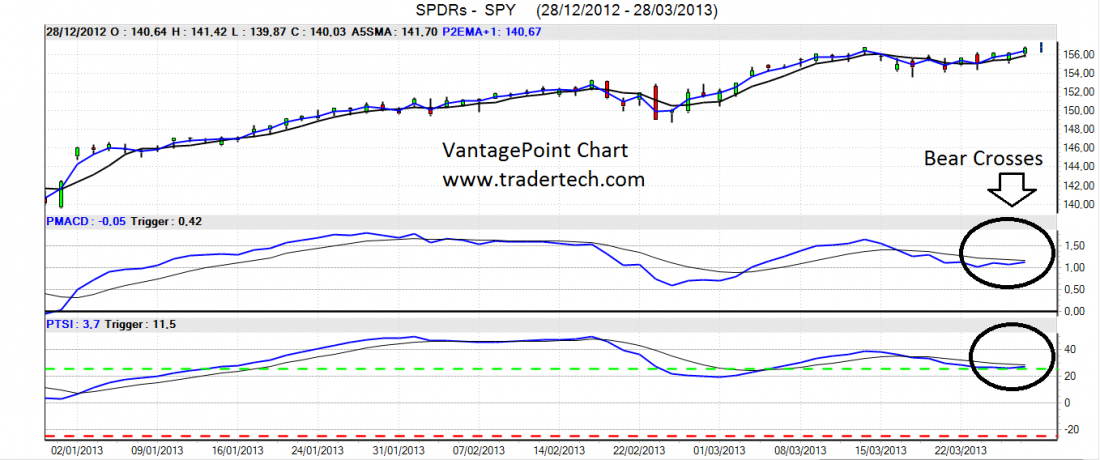
In order to obtain confirmation of these toppish indications, we draw up a chart on the Vantage Point Software on the SPDR S&P 500 ETF Trust: SPY.
Two of their powerful indictors in their toolbox are also showing signs of exhaustion and confirm the possibility of an upcoming correction. The Predictive MACD and the True Strength Index both have bear crosses and are pointing downwards.
BOTTOM LINE
If SPX continues to push higher, we should trade with caution as the drop could come at any time. Once it happens, follow the weekly MACD indicator since a correct interpretation on it will give an idea of where to find a bottom.
==

