

I like to know all the different ways things work rather than just picking one way that does work and sticking with it. This is probably my biggest weakness as a trader. Don’t get caught in this trap.
SECRETS TO SUCCESS
That being said, when you layer a few complimentary strategies on top of each other, you can have some fantastic results. This week, let’s talk about using regression trend channels in combination with trendlines to identify trending moves, and pick swing points.
Below, is a random graph of the euro that coincidentally fits my example perfectly. (Ok, that was sarcasm, but it’s important to identify good examples so we can recognize them before looking at real world applications.)
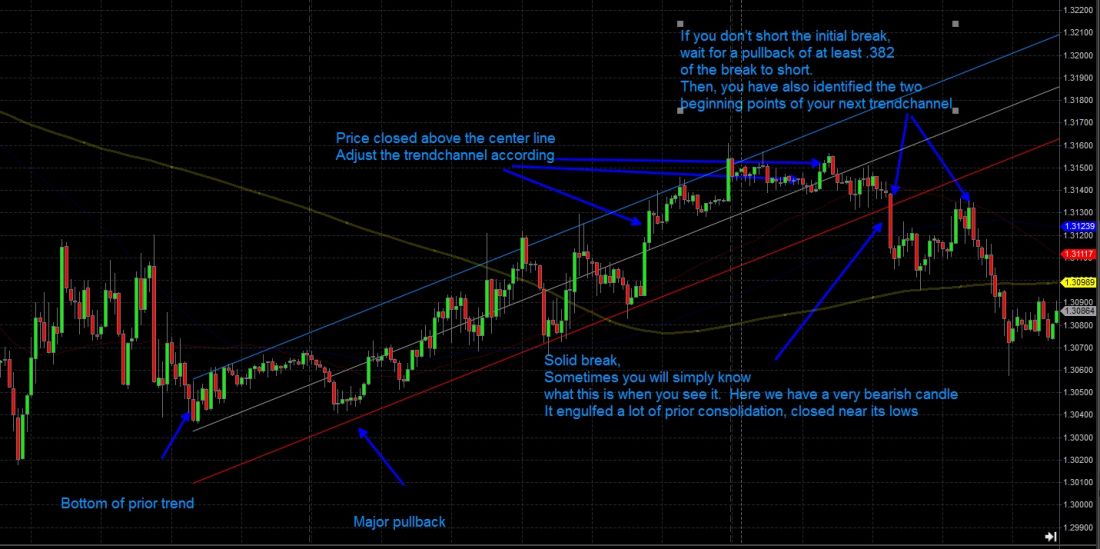
For those of you who don’t know, a regression trend channel draws the middle line through the average of price movement. Then you set the outside lines at a number of standard deviations away from that line. Generally two standard deviations away from the middle line works.
Next, you pick major pivot points. Once a trend has changed, use that recent bottom as a starting point. Wait until the trend has had time to develop a little. Usually, this is one good pullback on the 15 minute chart (other timeframes work, but let’s stick with this for now).
Next, as time progresses, if the next bar closes above (in our illustration) the middle line, extend the channel one more bar. If it closes below, leave it alone. Keep doing this until price closes below the lower channel line. Once that occurs, you have a reasonable expectation of a trend change. You may short that close or wait for a pullback for better pricing. Your stop (if you need one) is defined above the prior high, and your target can be a fib retracement of the swing move you just left. (.382, .5 or .618).
If you simply want to babysit the trade, start drawing a new channel and exit your short trade when the trend changes again. You may want to lock in profit, moving stops down to just above pullback support. This channel tends to clear up some of the clutter trendline breaks leave behind. You can use trendlines in addition to help you gauge the validity of a break or line hold. Again, the more things you get working in your favor, the better your results will become, but be careful not to stack too many things up otherwise you’ll start getting too many contradictory signals. There is still a great deal of discretion and “feel” when implementing this type of technical trading.
Next week, we will use this same graph, and expand on the strategy.
= = =
What’s Better Spot Forex or Futures? Find out in this story.
Trade Forex Overnight: Learn the Night Owl Strategy

