

It hasn’t been a secret that gold took some punches in October.
After a decline we begin to look for levels of support to get an idea of where traders may begin adding long positions. There are many ways to skin a cat and probably even more way to find support for a falling security.
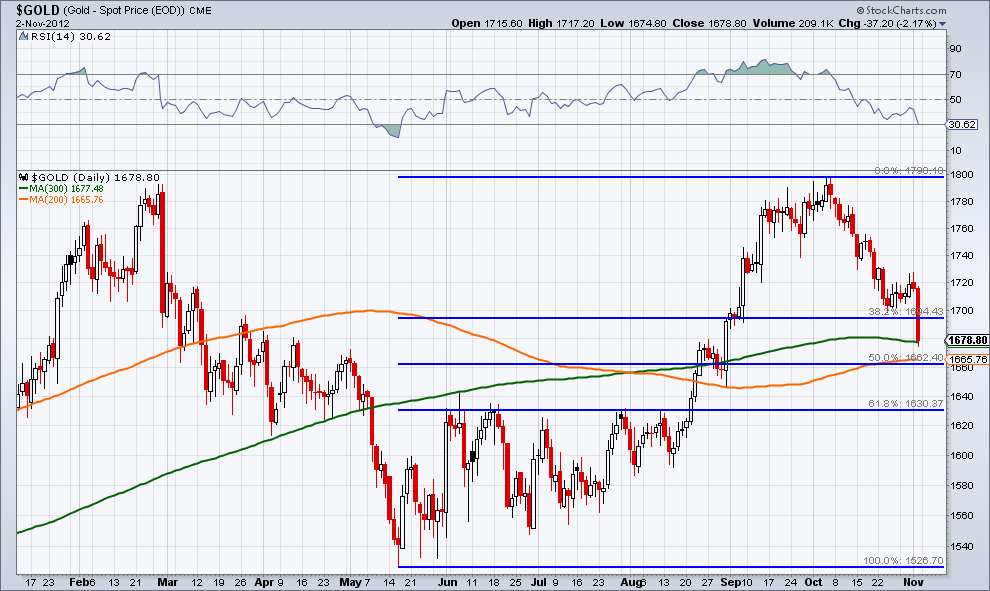
The chart below shows a few different levels of support that traders could expect to hold. The first, and most likely to hold, is the 300-day moving average (green line on the chart). While the 200-day moving average (orange line) gets most of the attention when it comes to technical analysis, it seems the 300-day MA is well-respected by gold traders.
Going back to 2002, gold has not given a solid break through its 300-day moving average except during the chaos of 2008 and more recently in early May of this year. On Friday gold hit this moving average and gave a slight bounce, we’ll see if it continues to hold. Next up is the more popular 200-day moving average which sits just a few points above the 50% retracement from the May low to the October high.
When turning our attention to momentum, on the top panel of the chart we have the 14-day Relative Strength Index, it’s just now getting close to being oversold (a break below 30) but this hasn’t been accomplished yet, giving some lingering hope for bears who are just joining the party.
Taking our timeframe from daily to weekly, the weakness experienced in gold hasn’t been THAT bad. Like I said earlier, it’d down rough 5.5%. To really say that gold is oversold, it appears we would need to have gold back down its May ’12 and Dec ’11 lows of $1550/oz. This is where your own trading plan and risk management comes in. If you are scalping this market or just holding positions for a few days, the price action in gold is telling you one thing, if you take a step back, things in this precious metal this decline might appear healthy and not nearly as drastic as previous drops.
Some form of consolidation may be necessary for traders to start entertaining the idea of a long gold position, but understanding where the levels of support are and how a security reacts to those levels is often a way to obtain clues if the decline is in an exhaustion phase or just getting started. Stick to your plan and timeframe and respect the risk tolerance that works best for you.
Disclaimer: The information contained in this article should not be construed as investment advice, research, or an offer to buy or sell securities. Everything written here is meant for educational and entertainment purposes only. I or my affiliates may hold positions in securities mentioned.
[Editor’s note: For more information on Thrasher’s view on gold, see his September 23rdcomment.]
= = =

