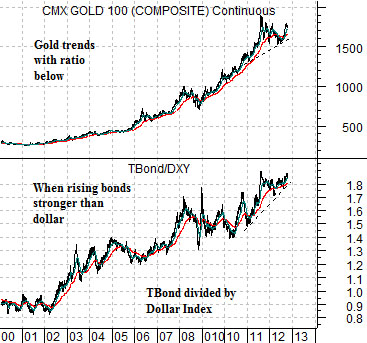
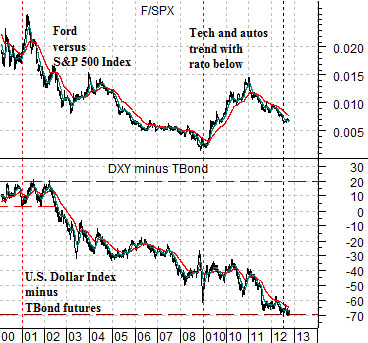
The trend for the dollar and bond market determine the underlying trend.
Over the past few days we have spent some time showing comparisons between the U.S. dollar in 1995 and 2011. The idea was that the trend in late 2012 may be similar in some ways to the final quarter of 1996.
The problem with this is that it contradicts some of our recent work. Perhaps ‘contradicts’ isn’t the right word but given our tendency to be early- often significantly early- on trend changes we thought we would at least make an attempt to explain how this might impact our thesis.
Our view has been that the defensive stocks would outperform until the markets make a ‘cyclical pivot’. The pivot would include falling bond prices and rising interest rates as well as strength in economically sensitive asset prices. Fair enough.
The issue isn’t whether a pivot will occur but rather when it will show up. If we take the post-1995 example literally the argument may well be that this will not take place for another… two years.
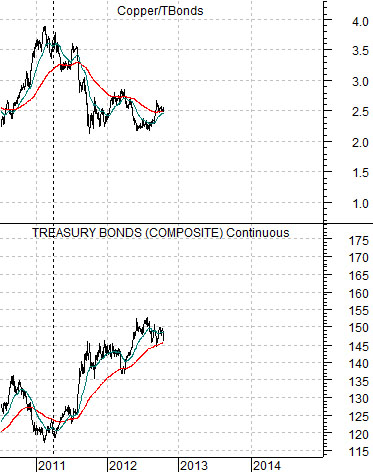
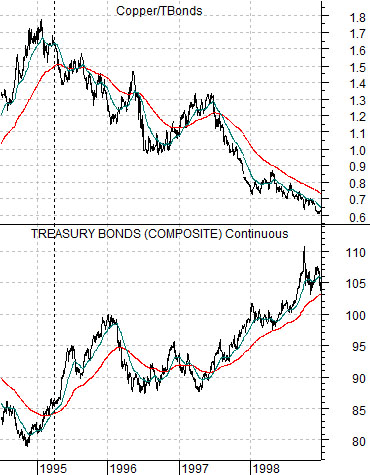
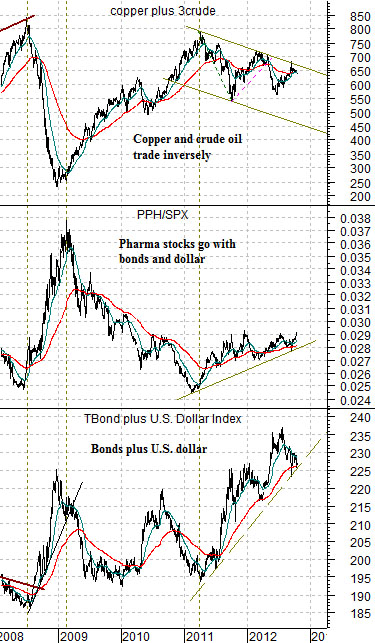
Below is a chart of the TBond futures and the ratio between copper futures and the TBond futures from 2010 to the present day. Below is the same comparison from 1994 into 1998.
If we can line up the dollar in 1995 with the dollar in 2011 then the same might be true for the bond market. If the trend began around the start of 1995 in response to rising bonds and falling copper prices then the same thing could be true for the first quarter of 2011.
The point? Following the start of the trend in 1995 the cyclical pivot was not reached until the autumn of 1998 and that lines up with something closer to the end of 2014.
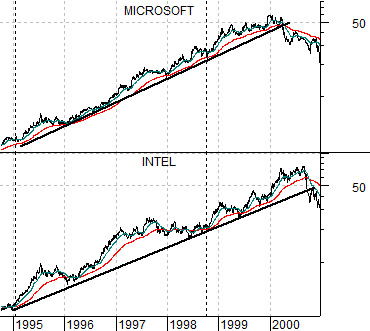
Below is a chart of Microsoft and Intel from 1994- 2000 scaled in semi-log. Notice that the trend began in 1995 so much of what happened through the Nasdaq’s ‘bubble’ in 1999 was late-cycle ‘catch up’ by related sectors. In other words the basic trend began in 1995 and continued until virtually everything related to tech and telecom went parabolic. The final stage went with rising interest rates over the cycle’s final 15 to 18 months.