

This past week, the NASDAQ hit the 5000 level for the first in nearly 15 years, and here come the mixed feelings on Wall Street. Some worry, but others see the market as just getting started for the year. Of course, a concern remains whether the market will plunge. Many traders still remember the NASDAQ’s dizzying drop down to the 1,100 zone.
So is the party over? Historically, a bull market lasts about six years and this upcoming Monday, we celebrate the 6-year anniversary. That does not necessarily mean the uptrend is over. We are still trading in a news-driven environment and a pre-election year, which can suggest a trend continuation.
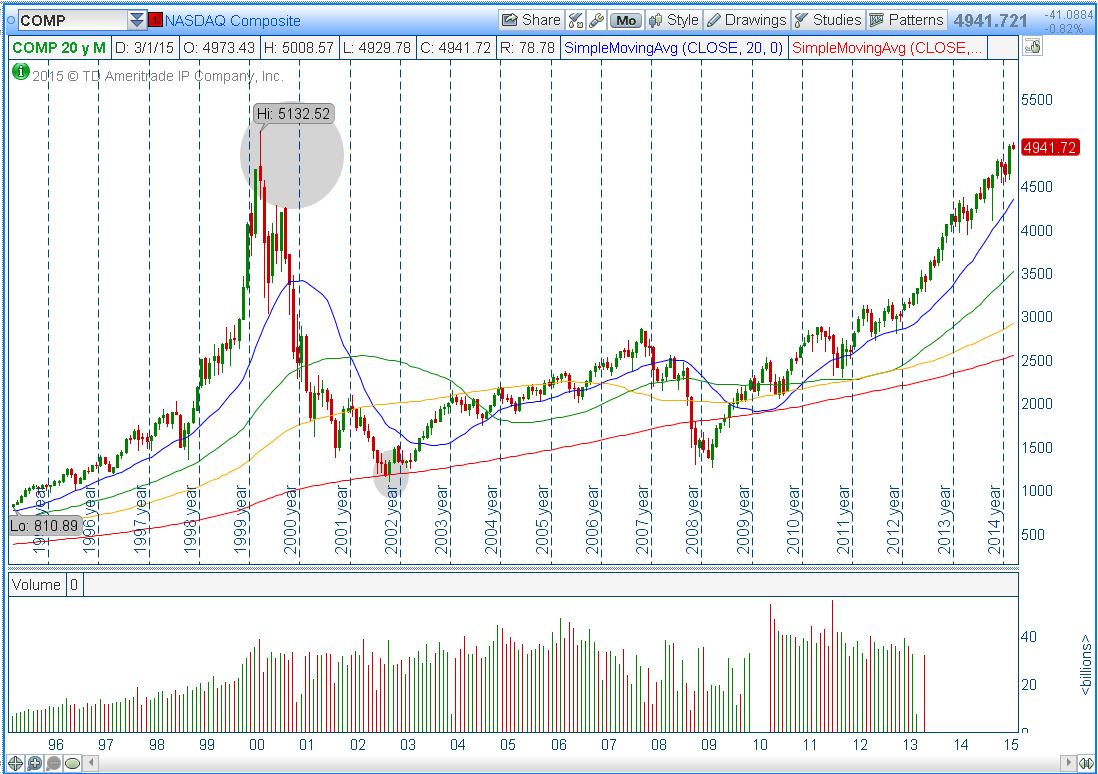
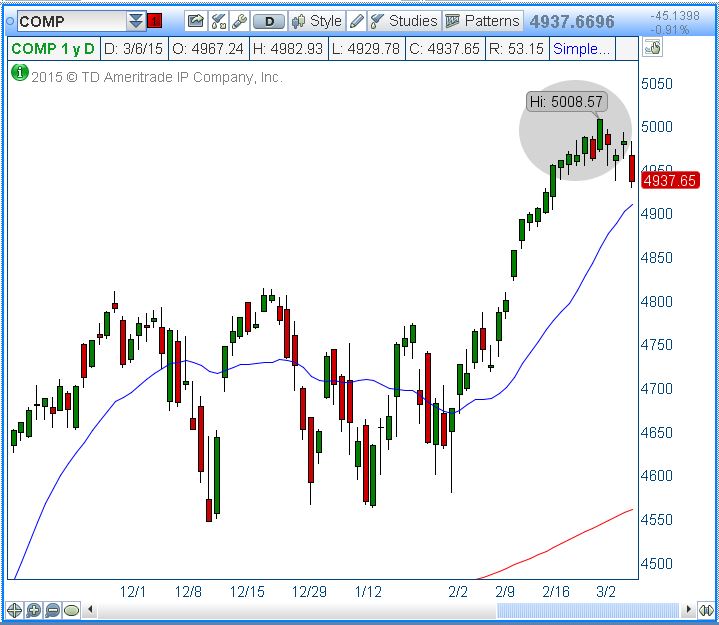
So what differentiates the first rally from the second? Technically, if you look at the chart of the first NASDAQ ascent above, the climb was very sharp and the growth was rapid (as well as the crash). The second chart shows a more gradual rise the second time around, which suggests more sustainable growth.
Heading towards the third quarter of 2015, high volatility may remain a constant in the current equities market and may even increase. This may be the well-defined characteristic for this year’s trading scene, and this aspect always tends to favor more swing trading rather than investing. A strong discipline to enforce into 2015 will be strong risk-management discipline for all traders.
Stocks should continue to outperform bonds. Historically, equities have provided long-term returns that have exceeded bond returns by approximately 500 basis points. On top of that, investors still maintain a good appetite for stocks.
What’s ahead? Let’s take a look at the technical levels of QQQ and SPY below to determine the next possible direction for the small and medium term.
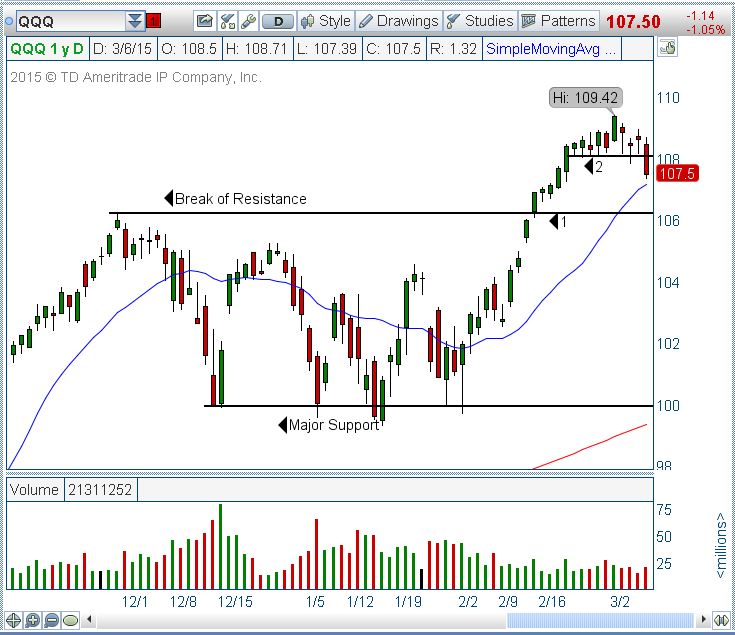
QQQ
After hitting a new high of $109.42 and breaking above last week’s range on Monday, the QQQ traded within tight daily parameters all week ($108.00 for support and $109.00 for resistance) until Friday when the QQQ power trended lower all day, breaking support at $108.00 (area 2 on chart) filling the void on the daily chart. If this downtrend continues throughout next week, a revisit of $106.00 (area 1 on chart) is possible, since there is a void into this next support zone.
- Bias: Neutral due to correction, still maintaining the uptrend on large time frames.
- Support Levels: $106.25, $105.35, $104.60, $102.50, $100.00
- Resistance: $109.42 and void into $120.00
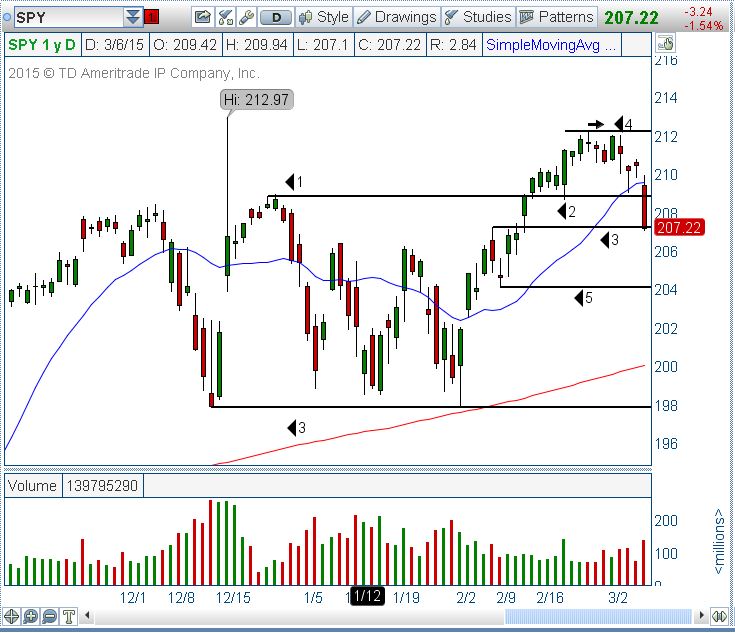
SPY
After a bullish start of the week (on Monday ) where the SPY came close to taking out resistance (marked with #4 on chart), but quickly reversed and started selling all throughout the week. The big sell day was on Friday when the SPY tested $207.00 area. If this trend continues, we can see a steeper correction into $204.00 (next area of support – number 5 on chart).
Let’s not forget that the market was getting over extended and long trades were very hard to find. This pullback will offer us new opportunities when correction resumes.
- Bias: Neutral
- Support: $207.00, $204.00, $198.00
- Resistance: $215.00
#####
For more information on Anka Metcalf and TradeOutLoud, please click here.
@AnkaMetcalf

