

Last Tuesday’s headline was: SPX- Turn-Down Period. And that is exactly what has played out so far. It wasn’t a guess, it was a strategic view based on where investor sentiment was, technical divergences, and our Sentiment Timing Index turn date. Here is a small piece from our February 18th sentiment timing newsletter identifying the turn period.
02/18: There is not much happening near term but prefer a few days of setback then perhaps drift higher into month end. If so, “Potential” exists for declines from say 3/4-5 into our next turn date higher.
The drop started on March 3rd, and we have seen the SPX drop almost 50 points from the highs. When looking at our next turn date higher period, we should start to see some choppy tape, but the bias will remain to the downside. Our investor sentiment levels still have room to move lower into bearish sentiment levels (the 10-day moving average), as bullish sentiment has been extended for quite a while.
Some clues that have shown up over the last three days suggest the drop is not over; we reached lower downside target very early into the Sentiment Timing Index turn period. No bullish divergences on the 60-minute charts. The wave structure is incomplete to the downside.
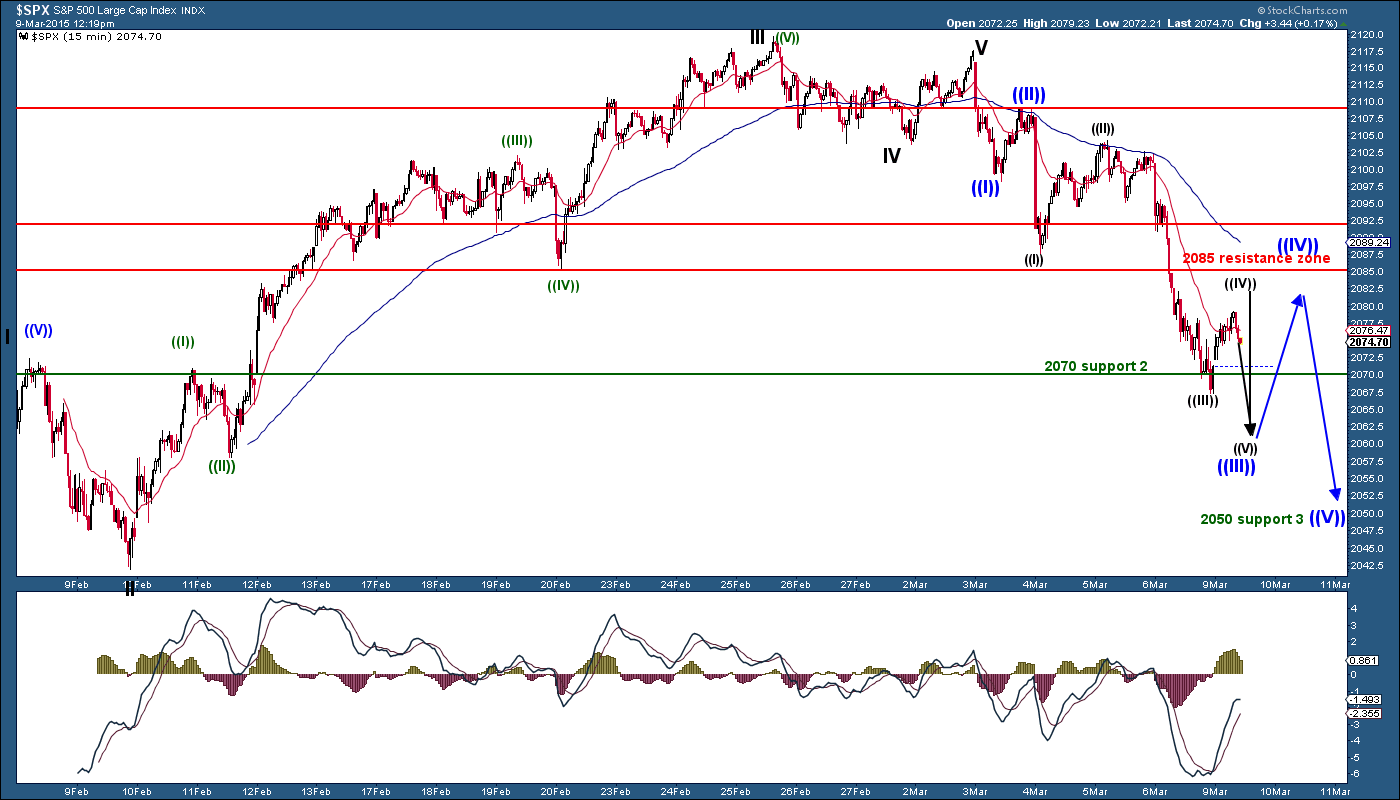
With our initial downside targets being 2086 and then 2070, the SPX hit the lower target within the first two days of our expected weakness period. There should still be more time left on the downside, when looking at our Sentiment Timing Index turn-date model. So the odds of 2070 being the actual low are not good odds right now.
Once everyone gives up on looking higher and bearish sentiment gets into extremes, we should see an important low hit, which will be a great buying opportunity. I will monitor support levels as we approach the expected low turn dates in the coming 3-10 days. For now, shorting rallies seems to be the safest trade for now.
#####
To get your free Sentiment Timing Index Chart, please click here.

