

If you’ve been reading my weekly articles for any period of time you know I am constantly looking outside of domestic markets in search of a potential setup around the globe. It becomes so easy for us to get entrenched with what’s happening in the Dow or the S&P 500 and ignore what may be happening in the equity markets of Egypt, Brazil, France, or in today’s’ case – India.
One of the first things I check on when evaluating a foreign equity market is how it’s performed in relation to the S&P 500. If a foreign market isn’t able to show strong relative performance, then it can be hard to justify the risk. This is one that the PowerShares India ETF ($PIN) has lacked. It’s not shown on the chart below, but since late 2010, PIN has underperformed the S&P as the relative performance line has made lower highs and lower lows. However since September we’ve seen the ratio between these two markets flatten as their respective price action begins to shadow one another.
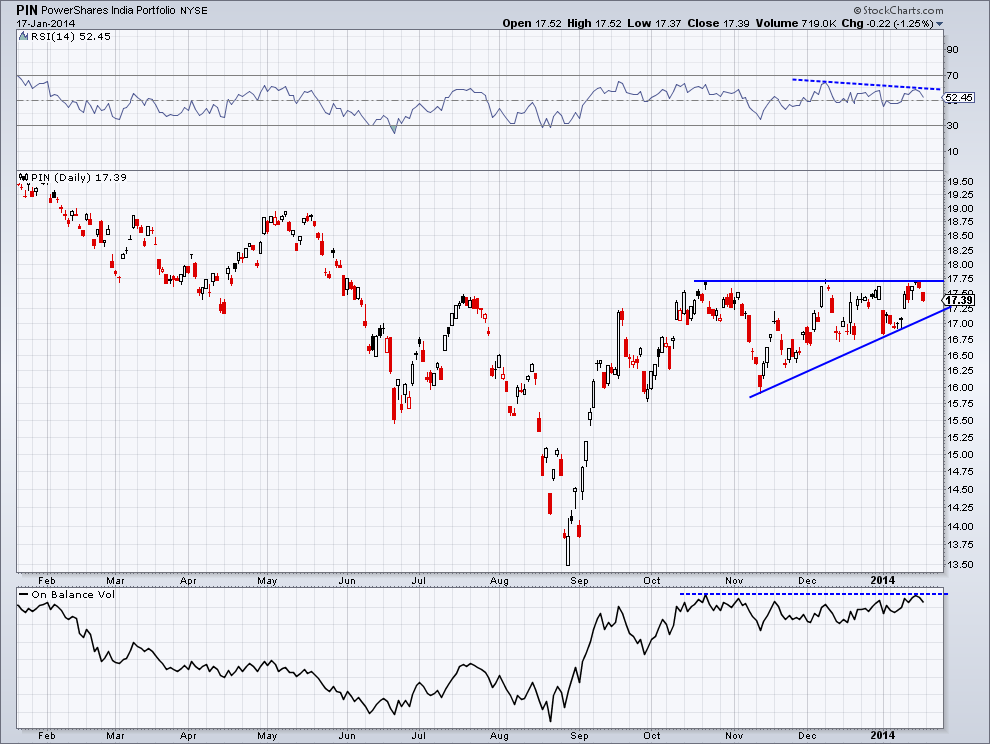
Looking at the price action for $PIN, we can see resistance since October has been at the $17.75 level which has batted down price three times. While price has been unable to make a higher high, each dip has been shallower than the last as $PIN puts in higher lows. This creates an ascending triangle pattern, which has historically led to a continuation of the preceding trend. We can use momentum and volume to get a better idea of where the bias may be when the pattern breaks.
In the top panel of the chart we have a momentum indicator called the Relative Strength Index (RSI). The RSI has flattened out over the last couple of months with a slight negative bias as it put in a lower high in January. Looking at the bottom panel of the chart we have On Balance Volume, which simply adds together the number of shares traded or subtract the number of shares traded depending on if it was a positive or negative session. This gives us insight into buying and selling pressure based on if heaver volume is trader on up days compared to down days (or vice versa). On each attempt to break through $17.75 we’ve seen On Balance Volume bounce off the same level – not indicating whether we are seeing a buying or selling bias during this period of consolidation.
Going forward I’ll be watching to see if $PIN is able to break out to the upside and make an attempt to test the May 2013 high of $19 or if the slight negative divergence in the RSI indicator is correct and we see a break of $17 as Indian equities head lower.
Disclaimer: The information contained in this article should not be construed as investment advice, research, or an offer to buy or sell securities. Everything written here is meant for educational and entertainment purposes only. I or my affiliates may hold positions in securities mentioned.

