Regulation Fair Disclosure, or “Reg FD” as it is more commonly referred to, has been blamed for the fact that during earnings season these days we tend to see a lot of stocks that either gap up or gap down following their quarterly earnings reports.
New and material fundamental information about the company hits the market by surprise and so an immediate price adjustment, a big gap one way or the other is often the result. In the past, companies used to selectively provide information and hints about the current state of a company’s business to favored analysts or holders of the company’s stock. This information would then find its way into price/volume behavior of the stock, providing a technical clue to investors who understood how to read such technical clues.
A LITTLE BACKGROUND
In August of 2000 the SEC decided that information about a company’s business should be released to all investors at the same time, without essentially providing up-front “inside” information to a select few. In pursuit of this, the SEC adopted Reg FD on that basis that it was intended “to address the selective disclosure of information by publicly traded companies and other issuers. Regulation FD provides that when an issuer discloses material nonpublic information to certain individuals or entities – generally, securities market professionals, such as stock analysts, or holder of the issuer’s securities who may well trade on the basis of the information – the issuer must make public disclosure of that information. In this way the new rule aims to promote the full and fair disclosure.”
AN EVEN PLAYING FIELD
One has a difficult time arguing that the intent of Reg FD is to promote fairness and an even playing field for all investors in the U.S. securities markets. Interestingly, the “Law of Unintended Effects” has come into play, however, as substantial and material information does not come out until an earnings report has been released. This has had the effect of making holding the stock of any company into an earnings report something of a game of “earnings roulette.”
THE BOTTOM LINE
The bottom line for investors is that big price moves can take place on the heels of earning announcements. When the big gap move is to the upside, we breathe a sigh of relief that we did not own the stock, but when it’s a huge gap to the upside, we lament the fact that we were denied the ecstasy of owning such a high-flying stock by our own lack of prescience.
BUYABLE GAP UP STRATEGY
But the fascinating truth is that it is often not necessary to try and bet on the outcome of a stock’s earnings report, because if one utilizes the “buyable gap-up” technique we described in our last TraderPlanet.com article one can easily latch onto and ride some very nice upside price moves that begin with a buyable gap-up following a strong earnings announcement. Let’s look at some real-world situations that prove this is true.
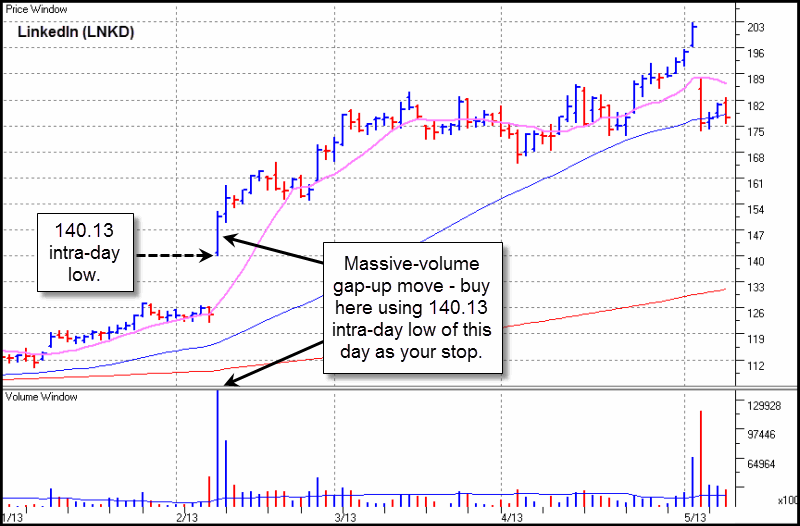
1) Linkedin (LNKD) posted a very strong earnings report on February 7, 2013, and the next day gapped up to the 140 price area. Based on the rules of a buyable gap-up, one could have bought the stock that day, using the 140.13 intra-day low of the gap-up day plus another 2-3% on the downside as their stop-out level or “selling guide,” as we like to put it. LNKD never looked back from there as it trended above the $200 price level over the next 12 weeks for a very nice and very profitable price move. One could then have sold into the gap-up move above $200 because that occurred on the day before earnings were to be reported and banked their profits as they awaited the outcome of that day’s after-hours earnings report. As it turned out, LNKD gapped down after earnings, your final sell signal, since one would have had sufficient time to exit on that day at a nice profit based on the initial entry on February 8th.

Chart 1 – LinkedIn (LNKD) daily chart, 2013 Chart courtesy of HGS Investor Software, (C)2013, used by permission.
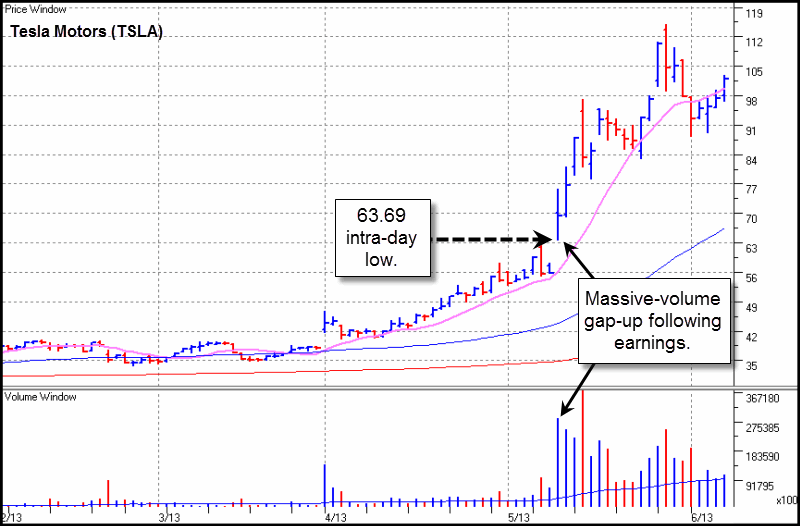
2) Tesla Motors (TSLA) reported earnings after-hours on May 8th, and the next day the stock gapped up to around the $70 price area. It then established an intra-day low of 63.69 before closing at 69.40. One could have taken a position right there using that 63.69 low as their stop. TSLA never looked back, however, as over the next three weeks is streaked to an intra-day high price of $114.90, and at the time of this writing is trading above the $100 level.

Chart 2 – Tesla Motors (TSLA) daily chart, 2013. Chart courtesy of HGS Investor Software, (C)2013, used by permission.
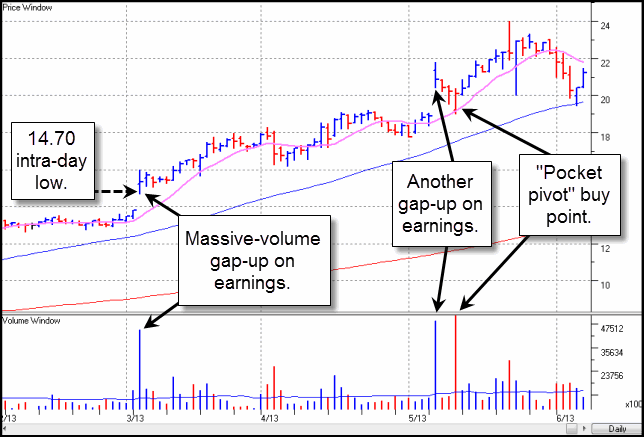
3) Drug maker Santarus (SNTS) announced a big earnings surprise on March 4th and on March 5th gapped up to 15.22 on the open, a 10.28% move up from its 13.80 close of the prior day. During the day on the gap-up day, March 5th, it pulled back a little bit to establish an intra-day low of 14.70 and closed at 15.34. SNTS was very generous as it gave investors another four days to buy it within range of the buyable gap-up day using the 13.80 intra-day low of that day as your stop. From there the stock never looked back, hitting an intra-day high of $24 on May 22nd before pulling down to test its 50-day moving average at the time of this writing in a move that could simply be the start of a new consolidation or “base-building” process.
Note that a second gap-up occurred in SNTS’ pattern after a later earnings announcement, but when the company simultaneously announced a 4.25 million secondary offering the stock dropped below the 20.42 intra-day low of that day, which would have stopped you out of any shares purchased that day as a result of the gap-up move. However, the temporary price drop eventually resolved itself with what we call a “pocket pivot” buy signal whereupon one could have theoretically re-entered the stock. On the other hand, if one had bought on the original gap-up move up through 15 back in early March, holding through the May earnings announcement might have been relatively easy to do. Proof, however, that not all buyable gap-ups work, but we have ways of dealing with re-entries using “pocket pivots, “a subject we will touch upon in a later article.

Chart 3 – Santarus (SNTS) daily chart, 2013. Chart courtesy of HGS Investor Software, (C)2013, used by permission.
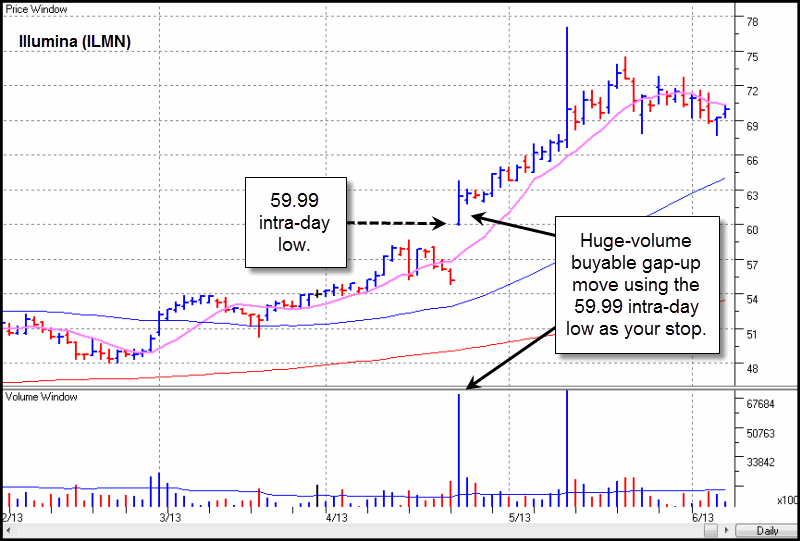
4) Gene research system maker Illumina (ILMN) surprised investors with its after-hours earnings announcement of April 22nd, and the next day gapped up to open at $60 before posting a 59.99 intra-day low and then closing the day at 62.44. Like SNTS, ILMN gave investors three more days to buy into the buyable gap-up move as it moved tight sideways before continuing higher.

Chart 4 – Illumina (ILMN) daily chart, 2013. Chart courtesy of HGS Investor Software, (C)2013, used by permission.
As we already stated, not all buyable gap-ups work, but when they occur investors are able to get on board in reasonably low-risk style by simply following the parameters for buying such moves that we discussed in our previous TraderPlanet.com article. Generally, the intra-day low of the gap-up day provides a nearby stop-out point that minimizes risk while allowing the investor to capitalize on a potentially strong upside move as the stock continues higher from the gap-up point. In this manner investors are able to play “earnings roulette,” except by waiting for the earnings report to come out first and then playing the ensuing gap-up move using our buyable gap-up technique, it is like waiting to see where the roulette wheel stops first, before placing one’s bet. And when it comes to profitable investing, it’s all about gaining an edge over the “house.” As can be observed with real-time real-world examples, buyable gap-ups provide that edge.
= = =
Gil Morales and Dr. Chris Kacher are both principals and managing directors of MoKa Investors LLC and Virtue of Selfish Investing, LLC, cofounders of www.selfishinvesting.com and co-authors of “Trade Like An O’Neil Disciple: How We Made 18,000% in the Stock Market” (Wiley, August, 2010) and their newest book, “In the Trading Cockpit with the O’Neil Disciples,” (Wiley, December 2012). Both are former internal portfolio managers for William O’Neil + Co., Inc., where Dr. Kacher also served as a senior research analyst and co-authored an in-house proprietary book “The Model Book of Greatest Stock Market Winners”, while Mr. Morales also served as Chief Market Strategist, Vice-President and Manager of the firm’s Institutional Services group, and co-authored with William J. O’Neil a book on short-selling, “How to Make Money Selling Stocks Short” (Wiley, 2004).


