

The most opportune time to study something in depth is when it is out of favor. Currently in the western world gold is very much out of favor. In spite of all of the inflationary pressures in the American economy gold has traded sideway for the most part. Precious metals enthusiasts have long held to the perspective that gold is despised by the mainstream monetary authorities. Traditionally, believers in big government policy believe that gold is an unproductive asset because it does not yield interest or pay dividends. Gold bugs on the other hand would argue what good are interest and dividends if your currency is being debased by inflationary pressures at a rate that is much larger than the dividends or interest you receive.
Therein lies the debate and conflict between precious metals and traditional financial assets. Some of the greatest investors of all time have achieved their greatness and wealth because they have learned to anticipate the decline in fiat currency and invest in companies and assets that grow faster than the rate the fiat declines. The formula is simple, borrow money at a low rate of interest and invest in a company that grows more than the current inflation rate.
However, critics of this philosophy claim that this is how the wealth inequality gap becomes worse as commo people do not have access to credit and their standard of living is decimated by the increased inflationary pressures.
To genuinely get a better handle on gold you must drop the dollar-centric perspective and look at it from the perspective of a global investor. That means you must compare it to other foreign currencies, and stock indexes which offer temporary stores of value for investors. This type of analysis forces you to look at everything as a store of value. From this perspective you can determine how effective GOLD has been in maintaining its purchasing power over time.
In this analysis, we will evaluate the GOLD market and look at it both as a commodity, a currency. We will use the following benchmarks in our analysis:
- Gold compared to Currency and Stock Indexes
- 52-week high and low boundaries
- Ten-year monthly chart high and low boundaries
- Best Case and Worst-Case Analysis
- Vantagepoint A.I. Forecast
- Neural Network Forecast
- Daily Range Forecast
- Intermarket Analysis
- Our Suggestion
Gold as a Currency Analysis
Any meaningful analysis of Gold has to be done over multiple time frames. Understanding the history of any asset depends on where you start and end your analysis. Since Gold is often viewed as a currency of last resort in today’s day and age, we prefer to analyze it over a longer-term time frame. However, in this analysis we will look at it from a short-term time frame as well. The purpose of our multi-time frame analysis is purely to determine how effective Gold is as a store of value in comparison to other currency asset classes.
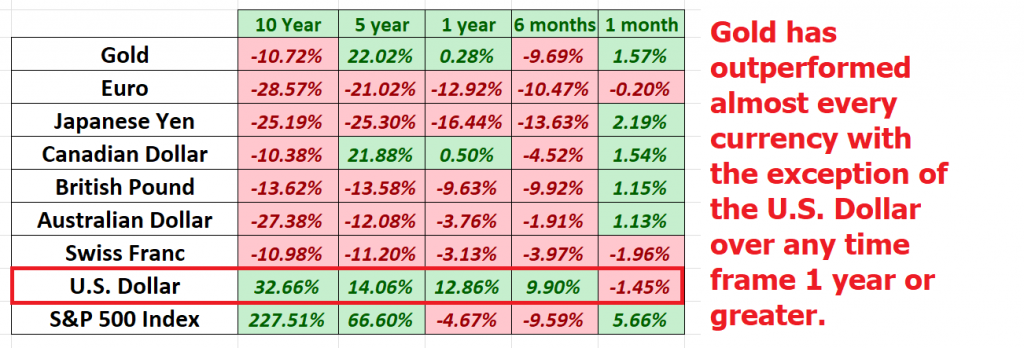
I have taken the liberty of color coding these performance metrics for ease of understanding. Green= UP. Reddish = DOWN. Simply look at the colors to see where the bleeding took place and where the money was made.
Here is what the performance metrics look like.

Over the last decade the U.S. Dollar has been the best currency to maintain its value. The U.S. Dollar is the worlds reserve currency and in times of great turmoil investors looks for the security of investing in dollar denominated assets. But I would urge you to look a little deeper. Observe how over a 5-year period Gold has outperformed all FIAT currencies, even the U.S. dollar. Clearly if you look at the yellow metal from an international point of view it has outperformed fiat time frames of one year or longer.
In other words, our trading partners are seeing the value of their currency decline quite a bit in comparison to the price of Gold. This also explains why U.S> stock indexes have done so well. As money flows out of paper currencies into stocks which try to grow faster than the rate of inflation.
My conclusion in only looking these metrics is that while GOLD is not yet in a bull market, it is clear that foreign currencies are in a bear market in comparison to GOLD. Simply based upon this reality GOLD should be on your trading radar.
Valuing Gold as a Commodity
Next, we want to compare the return on GOLD to the major stock market indexes.
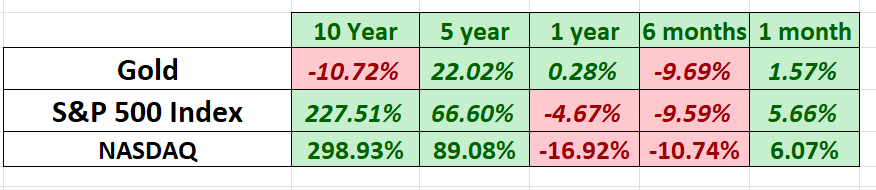
Over the last decade stocks have massively outperformed versus gold. But when you evaluate GOLD over the last year, 6 months, or month you will see that GOLD has kept pace with the broader stock market indexes.
As you evaluate these metrics keep in mind that the Consumer Price Index recently printed at 9.1% year over year. So, over the past year neither Gold nor stocks have offered a good store of value as inflation has reared its ugly face.
Our conclusion so far is that Gold is in sleeper mode. Most traders are unaware that it is performing positive against almost all-time frames when you price it as a stock, commodity, or currency.
52-Week High-Low Chart
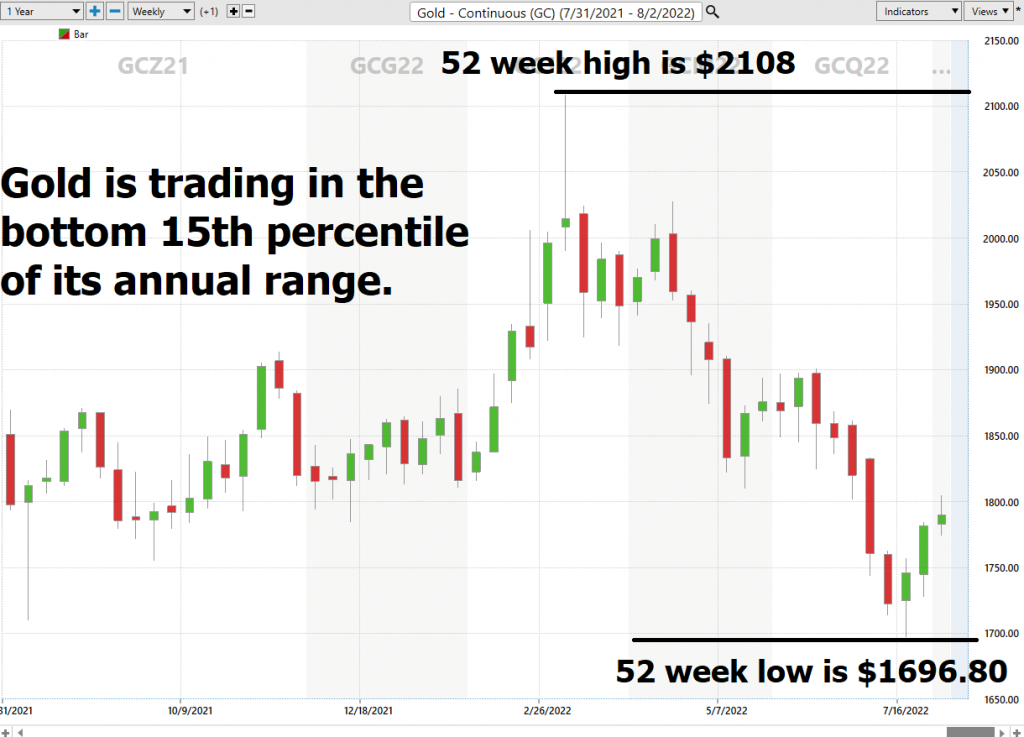
Next, we want to see where we are trading in relation to the 52-week range.
Over the last 52 weeks gold has traded as high as $2108.40 and as low as $1696.80. This provides us with an annual trading range of $411.60 When we divide this metric by 52 weeks, we can determine that the average weekly trading range for gold is $7.91.
What we often like to do as well is to divide the annual trading range ($411.60) by the current price ($1767) to provide us with a basic and generic calculation of how the annualized volatility for GOLD, which is currently 23.2%
What this number tells us is that we can define NORMAL during the next year if GOLD trades 23.2% higher or lower. That provides us with the following trading range as predicted by this basic volatility estimate.
Projected Annualized Volatility High Price = $2176.94
Projected Annualized Volatility Low Price = $1357
Whenever we trade, we always pay attention to where we are in relation to the 52-week trading range. It is quite common to see the 52-week high provide strong resistance to the market until it is breached. Often when the 52-week high is breached we will see the stock price explode higher very quickly over a short period.
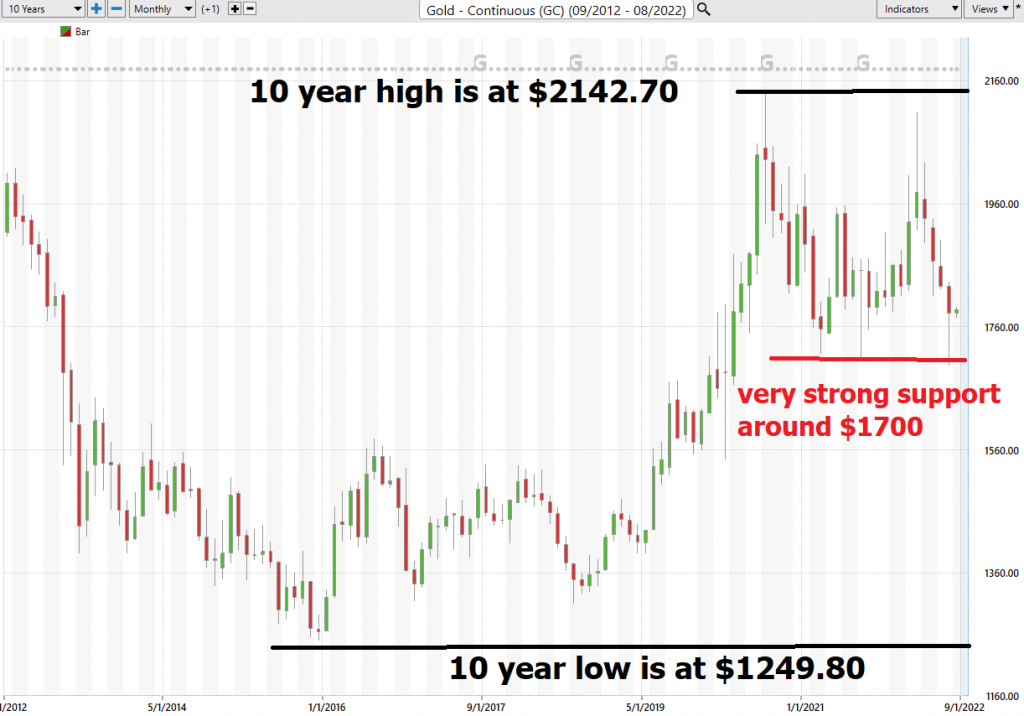
But let’s look at Gold on the longer term chart.
Best Case – Worst-Case Scenarios
One of the other ways we can use to understand the risks and opportunities in an asset is to analyze the downtrends and uptrends of the asset over the past year to comprehend the volatility.
When doing this analysis keep in mind that if change is to occur, we will see if in the performance of the asset. Meaning that is the worst decline was 16%, then moving forward a positive indication would be a decline of lesser magnitude.
Here is a snapshot of the drawdowns and uptrends in the gold market has experienced over the past year measured on a percentage basis.
It’s worth doing this type of baseline analysis because it allows you to quickly compare understand the performance of GOLD and to understand its risk and reward possibilities.
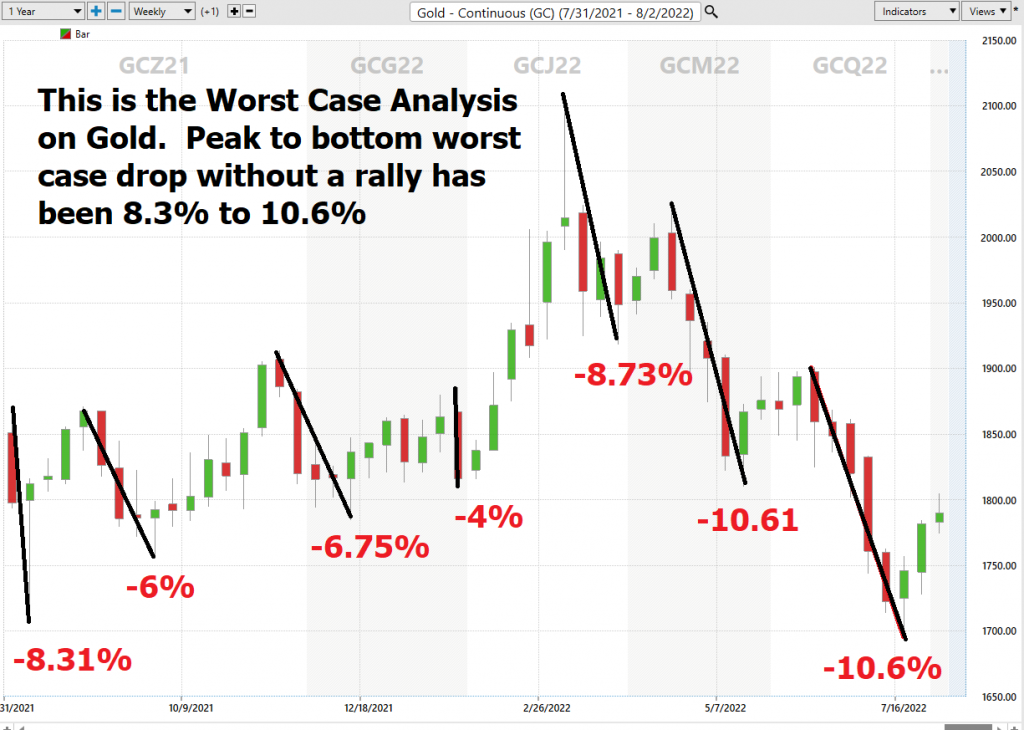
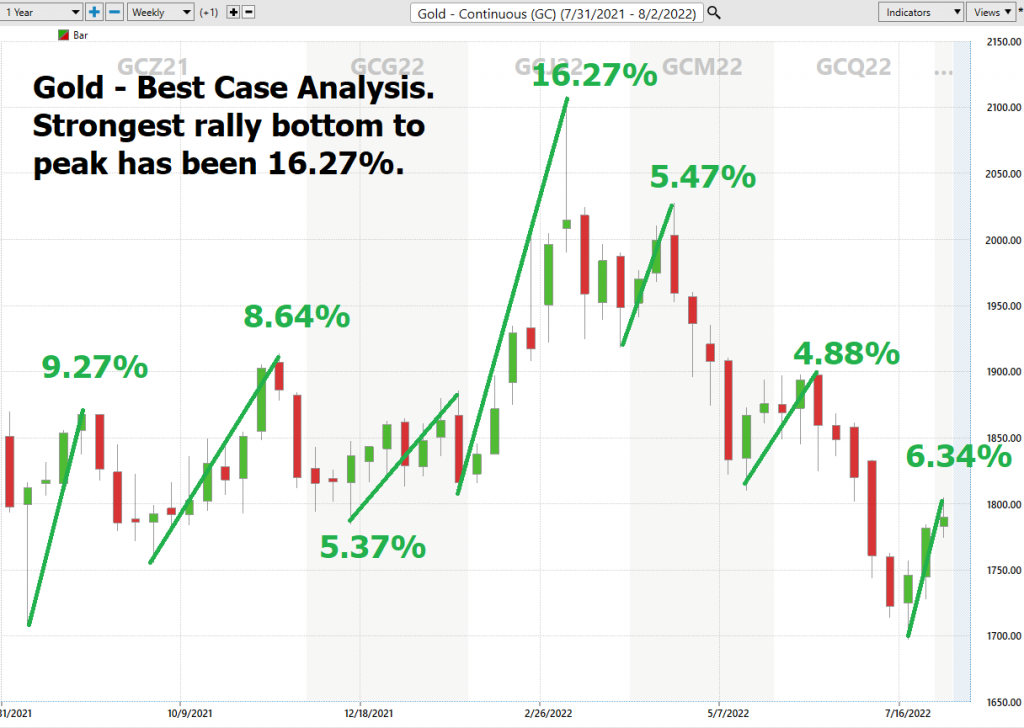
So, in the gold market we have an asset that has not been capable of mustering a rally greater than 16.27% before retracing its gains. Also, the declines have been mostly between 6% and 10.7%.
What is most frustrating about Gold is that with inflation raging at 9.1% you would expect that year over year that it would show exhibit gains that are a multiple of the CPI. So far this has not occured.
Vantagepoint A.I. Forecast (Predictive Blue Line)
On the following chart you will see the power of the VantagePoint Predictive blue line which determines the medium-term trend price forecast.
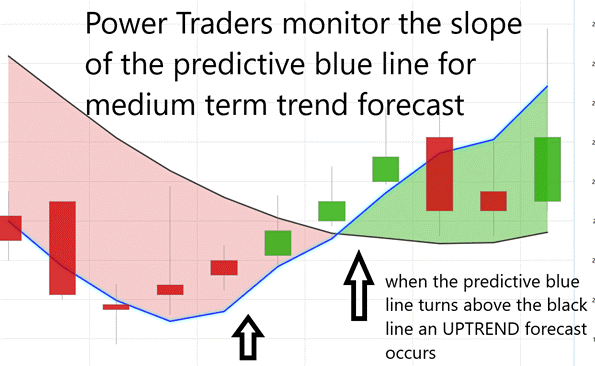
Using VantagePoint Software and the artificial intelligence, traders are alerted to trend forecasts by monitoring the slope of the predictive blue line. The black line is a simple 10 day moving average of price which simply tells you what has occurred in the market. The predictive blue line also acts as value zone where in uptrends traders try to purchase the asset at or below the blue line.
In studying the chart below pay close attention to the slope of the blue line.
Power Traders pay close attention to the relationship between where price closes in relation to the slope of the predictive blue line. Over the last 6 months there have been 6 completed forecasts and trades. The end result has been 13.81% while the gold market dropped 2.9% in value.
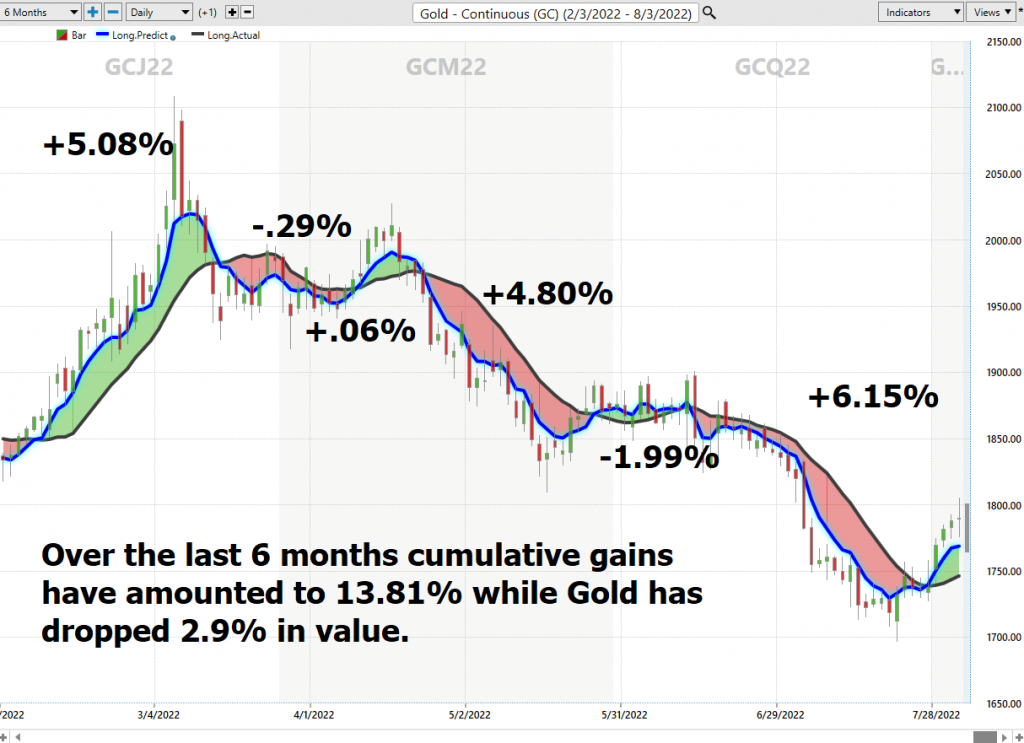
Trade #1 was a winner for 5.08%
Trade #2 was a loser for -.29%
Trade #3 was a winner for .06%
Trade #4 was a winner for 4.8%
Trade #5 was a loser for -1.99%
Trade #6 was a winner for 6.16%
Power traders use the predictive blue line in helping to determine both the value zone as well as the trend direction. In other words, in an uptrend traders try to buy the asset at or below the predictive blue line.
Fine Tuning Entries with The Neural Net Indicator
At the bottom of the chart is the Neural Network Indicator which predicts future strength and/or weakness in the market. When the Neural Net Indicator is green it communicates strength. When the Neural Net is Red it is forecasting short term weakness in the market.
A Neural Net is a computational learning system that uses a network of functions to understand and translate massive amounts of data into a desired output, consistently monitoring itself and improving its performance.
Neural networks are computing systems that are designed to mimic the workings of the human brain. import huge datasets and use quantitative methods to find patterns and correlations. They then use probability theory to make predictions based on those patterns. Neural networks are commonly used in fields such as finance, where they can be used to help make trading decisions. By analyzing huge datasets, they can identify patterns that would be difficult for humans to spot. They can also make more accurate predictions than humans, as they are not subject to the same biases and emotional decision-making. As a result, neural networks can be a valuable tool for making trading decisions.
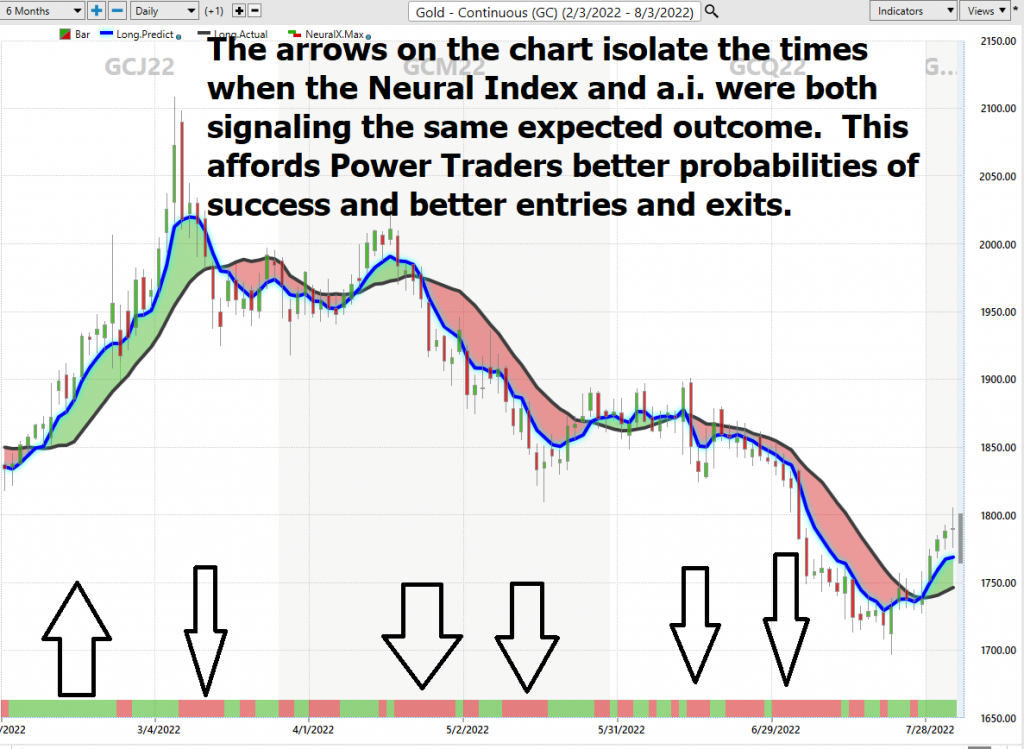
Whenever Power Traders are looking for statistically valid trading setups, they look for a DOUBLE confirmation signal. This signal occurs whenever the blue predictive line and the Neural Net at the bottom of the chart suggest the same future expected outcome.
We advocate that Power Traders cross reference the chart with the predictive blue line and neural network indicator to create optimal entry and exit points.
Power Traders are always looking to apply both the neural network and a.i. to the markets to find statistically sound trading opportunities.
We advise Power Traders to cross reference the predictive blue line with the Neural Net for the best entry opportunities.
VantagePoint Software Daily Price Range Prediction
The purpose of all these indicators so far is to help traders stay on the right side of the right trend at the right time.
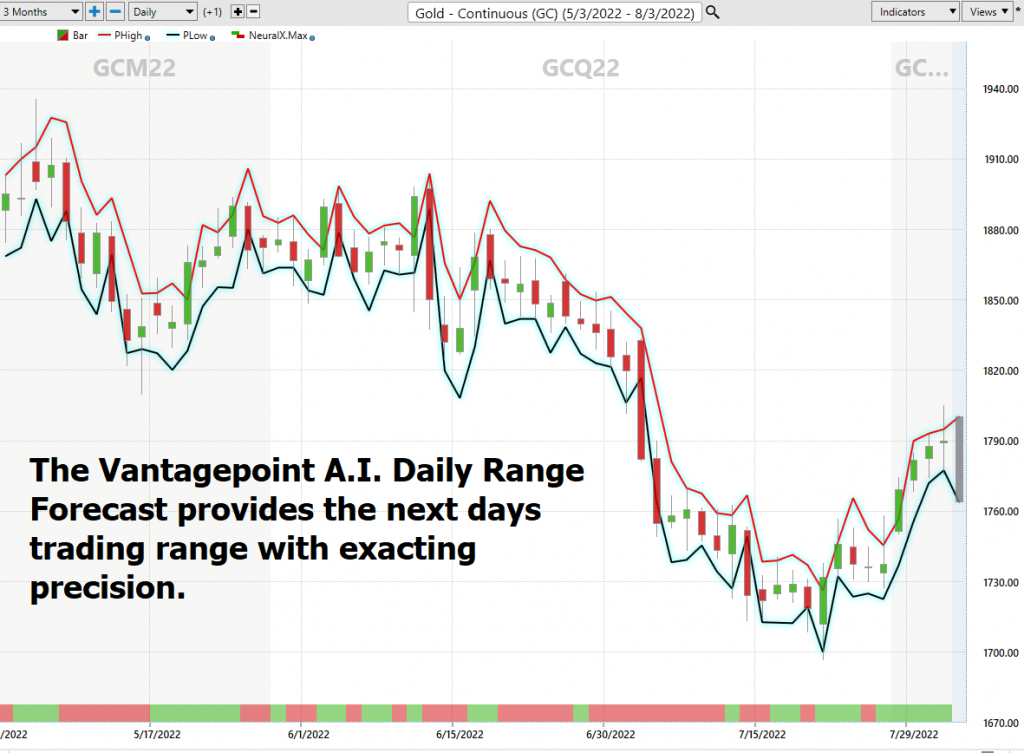
One of the powerful features in the Vantagepoint A.I. Software which Power Traders use daily is the Daily Price Range prediction forecast.
This forecast is what permits Power Traders to truly fine tune their entries and exits into the market often looking for smaller time frames and more granular trading opportunities.
Volatility and probability theory are two important tools that quantitative analysts use to assess market risk and predict price movements. By analyzing past price data, analysts can identify patterns and identify the likelihood of certain events occurring. This information can then be used to forecast a daily trading range for traders. Volatility is a measure of how much prices fluctuate over time, and it is a principal factor in determining a trading range. Probability theory is used to assess the likelihood of certain events occurring, and this information can be used to make predictions about future price movements. Together, these two tools can help traders minimize risk and maximize potential profits.
Here is the price chart of GOLD during the most recent 3 months featuring the Daily Price Range forecast and the Neural Net Indicator. Over the past year the largest daily trading range was $97.90. The smallest daily trading range was $8.70. The average has been $26.25. In spite of these wide variances, the artificial intelligence provides a very exacting and precise daily range forecast.
Intermarket Analysis
In finance, intermarket analysis is a method of analyzing different asset classes in order to identify trading opportunities. Traders use probability theory and statistical correlations to find relationships between different markets and make decisions about where to allocate their capital. By understanding how different markets are interconnected, traders can gain an edge in the marketplace and improve their chances of making profitable trades. While intermarket analysis can be used by any type of trader, it is particularly useful for those who trade in multiple asset classes. By understanding the relationships between different markets, traders can more effectively diversify their portfolios and reduce their exposure to risk.
What makes the Vantagepoint Software unique is its ability to perform Intermarket analysis and to locate those assets which are most interconnected that are responsible for driving the price of GOLD higher or lower.
Studying the charts can always provide objective realities in terms of locating support and resistance levels which become clear on a chart. But we live in a global marketplace. Everything is interconnected. The billion-dollar question for traders is always what are the key drivers of price for the underlying asset that I am trading?
These intangibles are invisible to the naked eye yet show extremely high statistical correlations.
Slight changes in Interest rates, Crude Oil Prices, and the Volatility of the dollar amongst thousands of other variables affect the decisions companies must make to survive in these incredibly challenging times. Trying to determine what these factors are is one of the huge problems facing investors and traders.
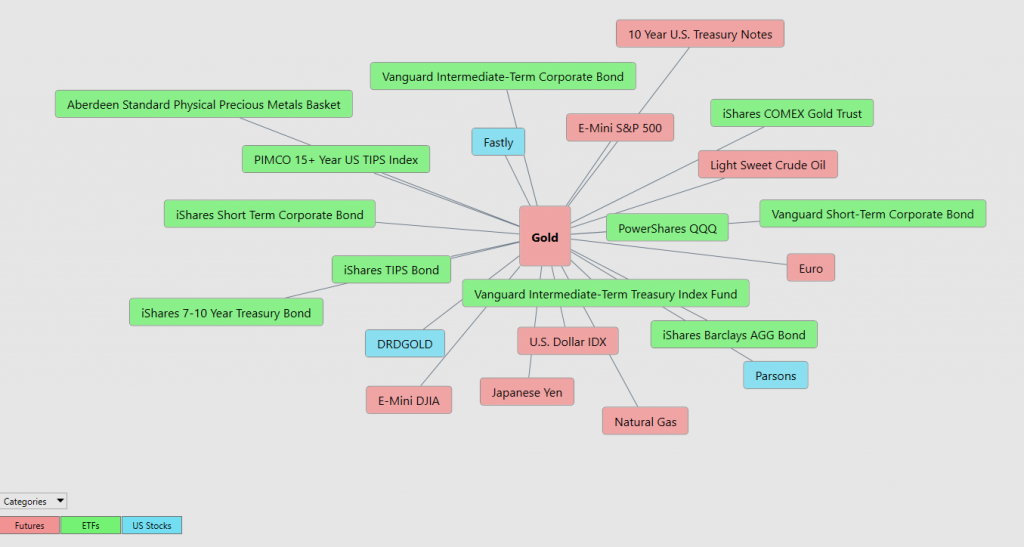
There is immense value to be had in studying and understanding the key drivers of gold price action.
By doing so you can often see which ETFs are most likely acquiring gold as well as uncovering other industries, commodities, forex which affect gold price movement.
Our Suggestion
Many analysts look at the debt situation in the world and conclude that gold will be the beneficiary of the massive currency debasement which has been occurring.
While we agree with this premise over the long term we live, eat, and breathe over the short term. As traders our only loyalty is to the trend.
In this analysis we looked at gold as a commodity, a currency While we are not in an official bull market yet in the yellow metal, we cannot get bearish based upon the simple reality that over the past year GOLD has kept pace with the broader stock market indexes and as a currency it is performing better than the currencies of any of the major G8 nations with the exception of the U.S. dollar.
As I write these words, the trend is DOWN. Our expectations based upon drawdowns over the past year, we suspect it will be relatively mild. I am looking for an opportunity to get bullish and will wait for further guidance from the artificial intelligence. We strongly urge that you should put GOLD on your trading radar.
As the U.S. dollar gets weaker, we expect gold to strengthen but the U.S. dollar recently made 10-year highs as it was the primary beneficiary of capital flows from currencies which have been decimated over the past few years. Gold does best when people lose faith in government. There is plenty of reason for this to occur, but it hasn’t as of yet.
Study the following graphic. Even though the last 10 years have not been great for Gold its day is coming based upon the huge increases in money creation which we have seen around the world.
Currency debasement is the process by which the value of paper money is reduced. This can occur for a number of reasons, but most often it is the result of an increase in the money supply. When more paper money is created out of thin air, each unit of currency becomes worth less and the purchasing power of individuals decreases. Inflation is often used as a measure of currency debasement, as it represents the decrease in the purchasing power of paper money. Devaluation is another term that is sometimes used interchangeably with currency debasement, but it more specifically refers to a sudden and significant decrease in the value of paper money. Currency debasement can have a number of negative effects on an economy, including inflation and economic instability.
We urge all traders to practice good money management and allow the artificial intelligence to guide your decision-making process.
As mentioned earlier in this analysis whenever an asset makes 10-year highs you need to place it on your radar as it is communicating to the world that it is growing and overcoming all obstacles related to its success.
Aggressive traders who are option savvy could consider selling GOLD put options.
We also think it is a very empowering exercise to do this similar analysis on gold mining stocks as they usually lead the yellow metal.
We will re-evaluate based upon:
- New 52-week high and low boundaries
- Vantagepoint A.I. Forecast (Predictive Blue Line)
- Neural Network Forecast
- Daily Range Forecast
Let’s Be Careful Out There!
Remember, It’s Not Magic.
It’s Machine Learning.

IMPORTANT NOTICE!
THERE IS SUBSTANTIAL RISK OF LOSS ASSOCIATED WITH TRADING. ONLY RISK CAPITAL SHOULD BE USED TO TRADE. TRADING STOCKS, FUTURES, OPTIONS, FOREX, AND ETFs IS NOT SUITABLE FOR EVERYONE.
DISCLAIMER: STOCKS, FUTURES, OPTIONS, ETFs AND CURRENCY TRADING ALL HAVE LARGE POTENTIAL REWARDS, BUT THEY ALSO HAVE LARGE POTENTIAL RISK. YOU MUST BE AWARE OF THE RISKS AND BE WILLING TO ACCEPT THEM IN ORDER TO INVEST IN THESE MARKETS. DON’T TRADE WITH MONEY YOU CAN’T AFFORD TO LOSE. THIS ARTICLE AND WEBSITE IS NEITHER A SOLICITATION NOR AN OFFER TO BUY/SELL FUTURES, OPTIONS, STOCKS, OR CURRENCIES. NO REPRESENTATION IS BEING MADE THAT ANY ACCOUNT WILL OR IS LIKELY TO ACHIEVE PROFITS OR LOSSES SIMILAR TO THOSE DISCUSSED ON THIS ARTICLE OR WEBSITE. THE PAST PERFORMANCE OF ANY TRADING SYSTEM OR METHODOLOGY IS NOT NECESSARILY INDICATIVE OF FUTURE RESULTS. CFTC RULE 4.41 – HYPOTHETICAL OR SIMULATED PERFORMANCE RESULTS HAVE CERTAIN LIMITATIONS. UNLIKE AN ACTUAL PERFORMANCE RECORD, SIMULATED RESULTS DO NOT REPRESENT ACTUAL TRADING. ALSO, SINCE THE TRADES HAVE NOT BEEN EXECUTED, THE RESULTS MAY HAVE UNDER-OR-OVER COMPENSATED FOR THE IMPACT, IF ANY, OF CERTAIN MARKET FACTORS, SUCH AS LACK OF LIQUIDITY. SIMULATED TRADING PROGRAMS IN GENERAL ARE ALSO SUBJECT TO THE FACT THAT THEY ARE DESIGNED WITH THE BENEFIT OF HINDSIGHT. NO REPRESENTATION IS BEING MADE THAT ANY ACCOUNT WILL OR IS LIKELY TO ACHIEVE PROFIT OR LOSSES SIMILAR TO THOSE SHOWN.

