

My favorite currency pair right now is the euro’s value to the dollar, which I wrote about last week. A close second is the Aussie dollar versus the greenback.
Evidence of a substantial improvement in momentum indicates the recovery off the January low has further to go. This is apparent in moving averages – two-day and 13-day – on the relative strength index. The green line illustrates how RSI averages put in substantially higher lows in December, compared with last May, despite lower prices. The slide to lower prices in January was a last gasp by the bears before control shifted to the bulls.
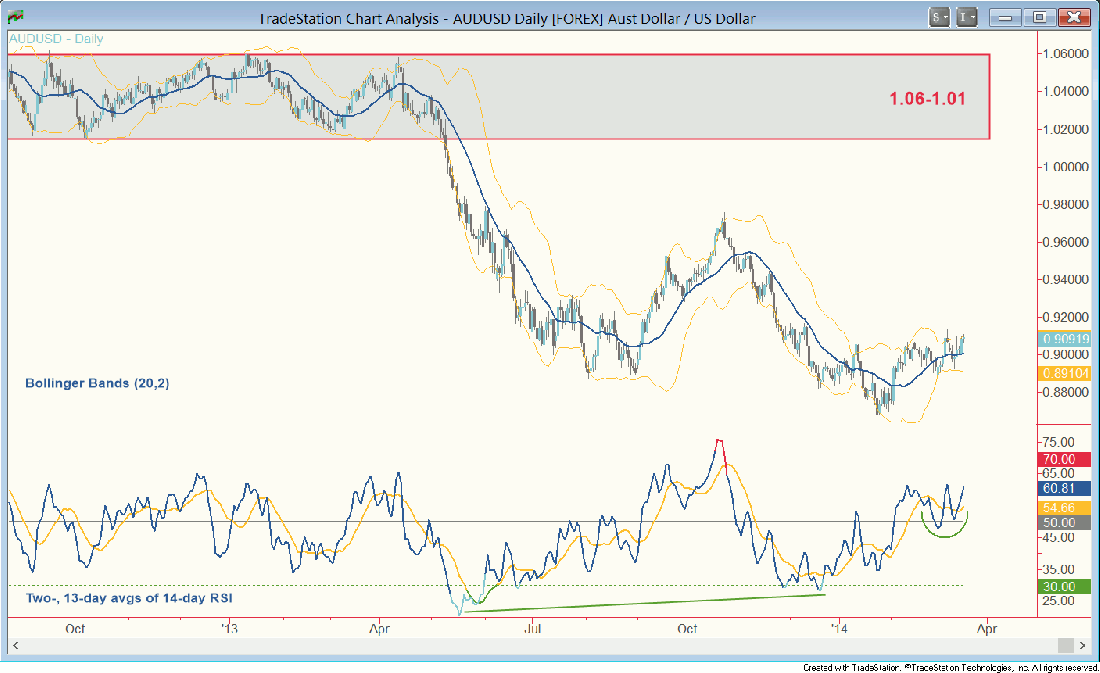
Now fast forward to the past month. Price moved into a range. Concurrently, RSI averages eased back to or near the 50 midline and stabilized (note the green arc). This is a common pattern of behavior during a dip or consolidation before an uptrend resumes.
TRADING STRATEGY
Don’t concern yourself with the extent of this uptrend. I don’t know any more than you whether a new primary uptrend is burgeoning or if this is a countertrend rally; the supply zone at 1.06-1.01 points to substantial upside potential but that’s no guarantee price will get up there.
The best way to trade this market is to go long and then base your exit on a downturn in the daily mean (20-day simple moving average), or some other trend following technique. That takes your head out of your decision making.
Good trading to everyone!
= =
Learn more about Burba’s independent financial research here.

