

The 30-minute chart on Australian/US dollar (AUD/USD) shows that price continues to respect the 1.0510 price region. Overnight price action was influenced by two key headlines.
WIDENING TRADE DEFICIT
The initial sell-off was sparked after a report showed that Australia suffered its biggest trade deficit in four years. International trade and goods and services widened to -2.64B versus an eyed -2.21B. Exports climbed 1% and imports increased by 2%. The initial reaction took the Australian currency to the lower boundaries of its recent 1.0460-1.0510 range.
BETTER CHINA VIEW
The weakness quickly became erased after People Bank of China’s Advisor Chen Yula forecasted Chinese GDP to exceed 8.0% this year. The outlook for inflation is expected to be contained in the first half of the year. As long as China remains strong, demand for Australian raw materials will remain high and exports should recover in the first half of the year.
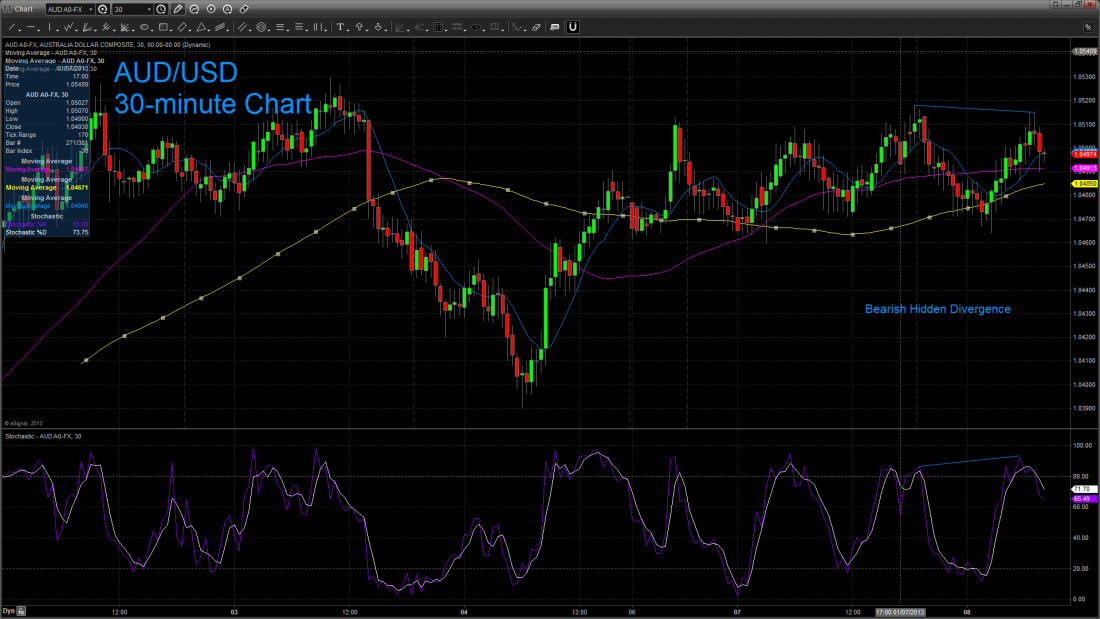
THE TECHNICALS
The chart is highlighting a potential Bearish Hidden Divergence, which occurs when price is making a lower high while the slow stochastic oscillator is making a higher high. This could be a sign that downward pressure may persist as price has once again failed to breakout higher.
If price continues to consolidate, a breakout above the 1.0520 level could see a test of the 1.06 level. Short-term support remains at the 1.0460 level with potential longer support at 1.0390.
= = =
Learn a new forex trading strategy here:
Catch Reversals with Donchian Channels
Read more trading ideas in our Daily Markets section.

