

Since 2009, when Bitcoin was birthed, cryptocurrency has increased its footprint in the asset management space. Many traders believe that one day this digital decentralized value transfer protocol currency could reach as much $1 million per coin. Over the years, a bevy of other cryptocurrencies have joined Bitcoin on the world stage implying that crypto is here to stay. But the various conflicting options you may receive from money managers on Bitcoin is astounding.
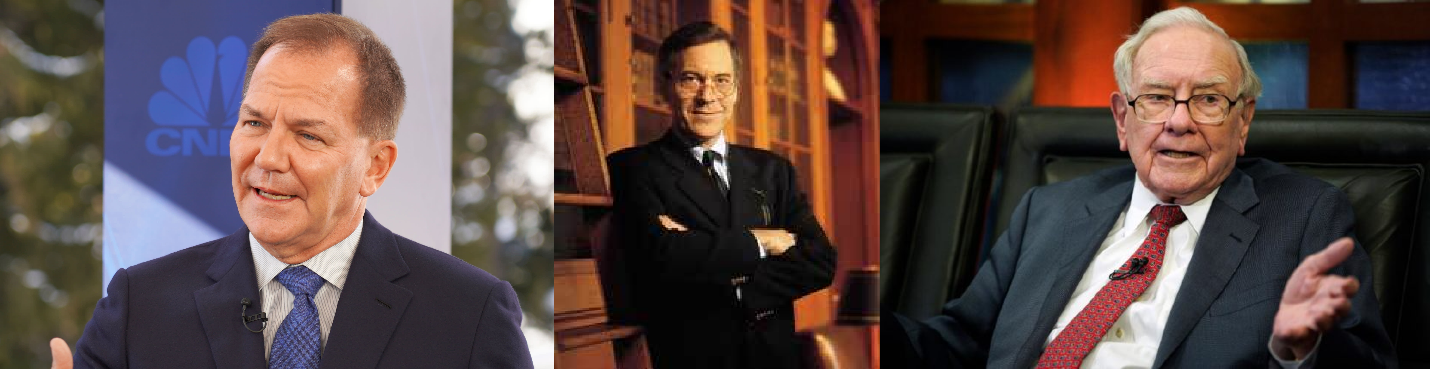
Take for example, Paul Tudor Jones his thesis on Bitcoin which can be accessed here is that Bitcoin is the fastest horse in the race. On the other hand, Warren Buffett considers Bitcoin to be “rat poison” and recently Steve Hanke, a professor of economics at Johns Hopkins University claimed that “Bitcoin’s intrinsic value is zero.”
What’s fascinating about these opinions is that in spite of the fact Bitcoin is a trillion dollar asset, a very large sector of the establishment still proposes that Bitcoin is rooted in a scam. One can comprehend perspectives that disagree with a Bitcoin world, but you do not become a trillion dollar asset unless people willingly benefit from their association with the asset class. Google, Apple, Amazon and Microsoft are all over one trillion dollars in market cap. You may disagree with their policies or offerings but they are not scams. Bitcoin is currency no one can take without your permission. It cannot be inflated away or confiscated, because no one person, company, or government controls it.
So much of the variance in Bitcoin stems from being willing to ask the question, “What is money?” For those that ask and dig into this question they come to realize and recognize that Bitcoin is an engineered monetary network that stores and transfers value better than any of its predecessors, even though it is only 12 years old.
In this chart study we’ll address how A.I. Power Traders create a short-term valuation on Bitcoin to exploit a trend.
Bitcoin is unlike any asset class that has ever existed. We have written extensively about Bitcoin (BTC) as an alternative asset class. You can read our articles here, here, here and here.
Let’s start our analysis with the commonsense metrics.
Over the last 52 weeks Bitcoin (BTC) has traded as high as $58,000 and as low as $3,925. This tells us that the annual trading range is $54075. The average weekly trading range is $1,039.53. These numbers are what we refer to baseline metrics which help us define and understand what is “normal” price action. Naturally, we look to amplify these results using artificial intelligence and machine learning.
Whenever we trade any asset it is important to understand where we are in comparison to its 52 week range. We are ardent believers that great traders pay very close attention to assets that are approaching and breaking through their 52 week highs. We endorse the perspective that a 52 week high will initially act as resistance until that boundary is successfully breached. When the breach occurs it is not uncommon to see the market move exponentially higher very quickly. Let’s examine this idea on the following Bitcoin chart. Observe how the 52 week horizontal line acts as RESISTANCE until it is conquered. Upon price moving through the 52 week high that zone often will behave as very strong support for the market.
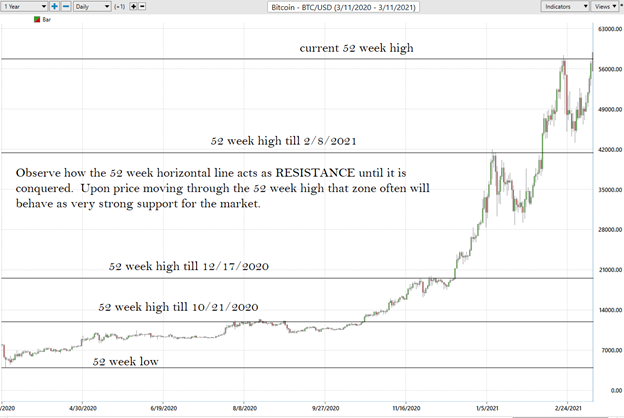
Using only this barometer for trading opportunities proved to be stellar in terms of potential returns as Bitcoin has rallied from $12,900 to $58,000 in less than 5 months.
The Vantagepoint A.I. Analysis (The Triple Cross)
Included in the Vantagepoint Software is a robust artificial intelligence module which provides short term, medium term and longer term forecasts for the market. Power Traders based upon their risk and volatility temperament will use these forecasts to position themselves accordingly in the marketplace.
The slope and the direction of the predictive blue line determines the trend forecast for the asset.
Experienced traders rely upon the Vantagepoint Triple Cross indicator which incorporates the short-term, medium-term and long-term trends to determine a trend forecast that is worthy of every traders attention.
Here is a chart which highlights the power of the Triple Cross indicator. If the blue line is above the black line the trend is UP. The ideal value zone to purchase is as close to the predictive blue line as possible.
When the blue line falls below the black line the trend is down.
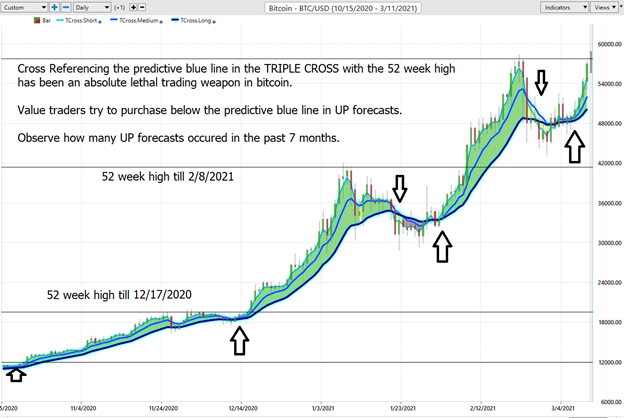
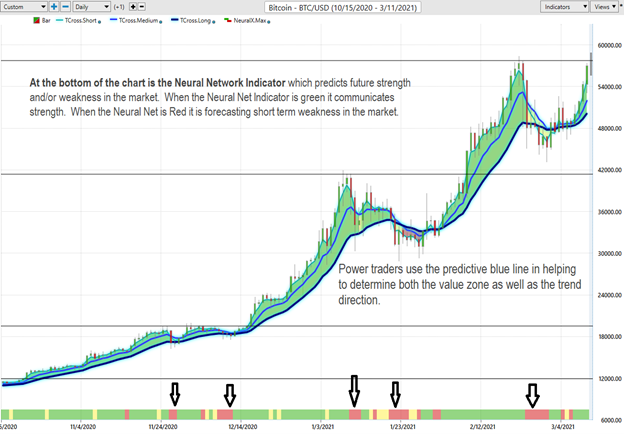
Power Traders use the predictive blue line in helping to determine both the value zone as well as the trend direction.
Vantagepoint Neural Net Indicator
At the bottom of the chart is the Neural Network Indicator which predicts future strength and/or weakness in the market. When the Neural Net Indicator is green it communicates strength. When the Neural Net is Red it is forecasting short term weakness in the market.
As you can easily observe, cross referencing the Triple Cross with NeuralNet indicator provides a very accurate forecast of future strength and weakness in the market.
The Vantagepoint A.I. Daily Price Range Forecast
The key problem with most technical indicators is that they only tell you what happened in the past. Real value lies in forecasting what is going to occur tomorrow. Within the Vantagepoint Software traders receive a Daily Price Range forecast every day informing them of a predicted high and low prices. This feature of the software is what traders rely on most when they are already positioned in a trade in the market.
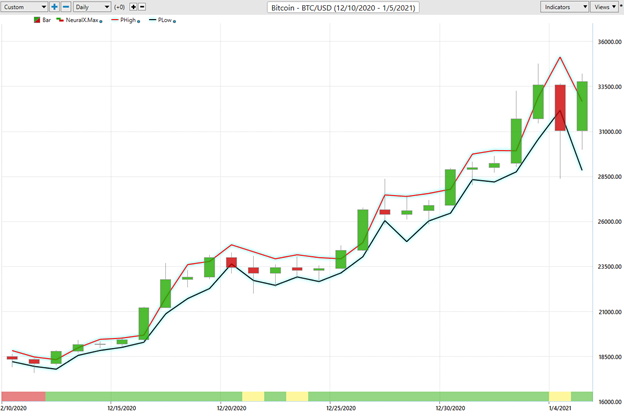
The chart below is a closeup snapshot of the daily price range forecasts of Bitcoin from December 10, 2020 till January 5, 2021.
The daily price range forecasts allows traders to fine tune their entries and exits. Power traders try to buy as close to the forecasted low price and sell above the forecasted high price.
In summary, VantagePoint Power Traders who are trading Bitcoin use the triple cross indicator to determine trend direction. They utilize the Neural Net Indicator to anticipate short term strength or weakness in the market. They cross reference both of these powerful A.I. tools with the daily price range forecast to receive a powerful predicted high price and low price forecast.
Traders customize the setup of their charts and indicators within the VantagePoint Software to meet their needs.
Here is the current Bitcoin chart analysis presented in a very powerful and straightforward manner.
- Slope of the predictive blue line determines trend and value zone
- NeuralNet determines short term strength and weakness
- Final bar on chart is the current predictive daily price range forecast which provides a forecasted high and forecasted low price
This is trading power at your fingertips and is how Vantagepoint A.I. Empowers traders daily.
Utilizing the Vantagepoint Artificial Intelligence traders are alerted to the strongest trends and the software is designed to keep you on the right side of the trend at the right time.
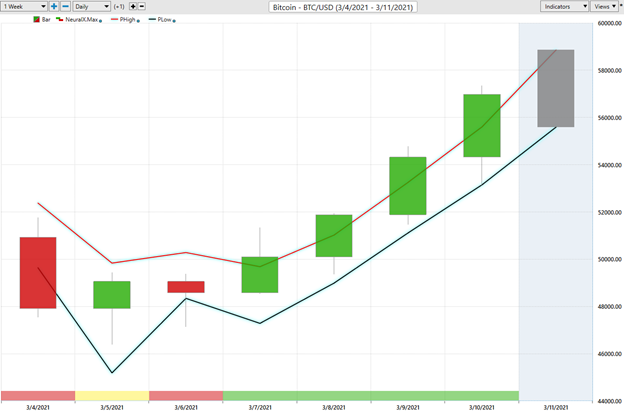
Here is a ZOOMED in version of the past week. March 3rd, 2021 thru March 11, 2021.
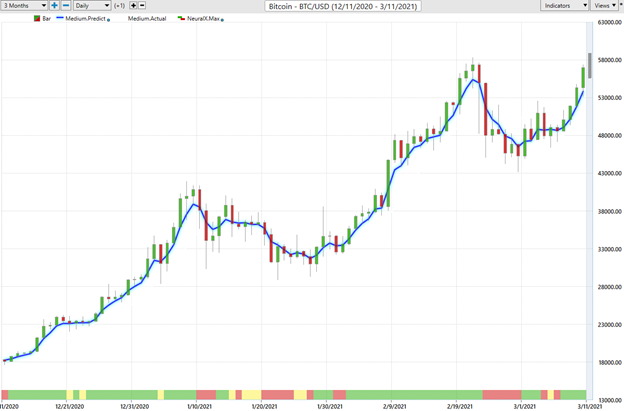
And the zoomed out version of the past three months.
What separates Vantagepoint Software from everybody else is…
Intermarket Analysis
Instead of guessing what is driving Bitcoin’s price why not focus on the factors, companies, commodities, mutual funds and ETFs that are statistically most correlated to the underlying asset to develop an understanding of key price drivers.
You won’t find truth from the talking heads in the media… they just promote a narrative that supports a story.
But a simple graphic which is available in the software will do wonders to help you understand which markets are most statistically correlated to Bitcoin.
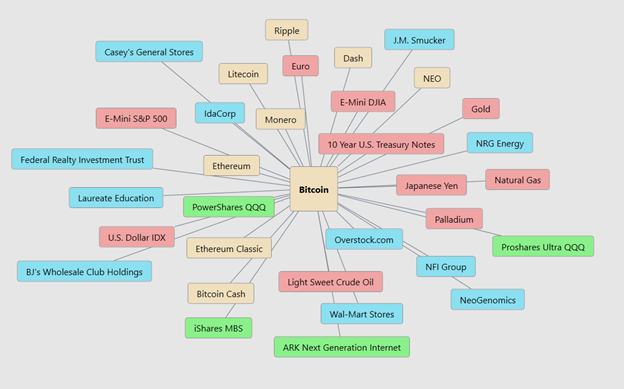
We live in a global marketplace. Everything is interconnected. The billion dollar question for traders is always what are the key drivers of price for the underlying asset that I am trading?
The above graphic highlights what is driving the Bitcoin price. It’s color coded so you can quickly determine which other crypto assets, ETFs, futures and stocks are most correlated to the price action.
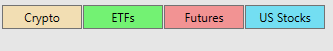
By studying the Vantagepoint Intermarket Analysis regularly you will find other opportunities with very strong trends that most traders are unaware of. Using the Intermarket Analysis will often allow you to see patterns and opportunities from a completely new angle.
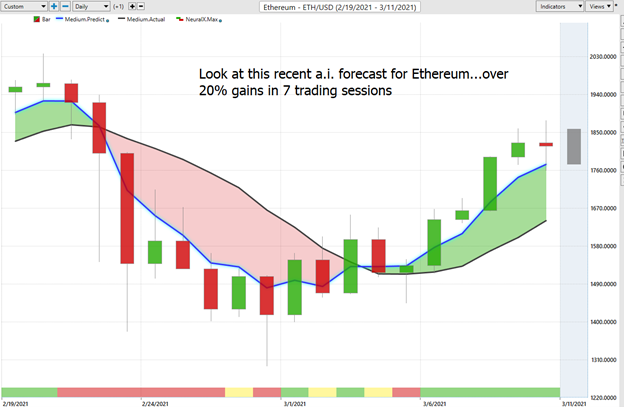
Let’s look at some of the key drivers as potential short term trading opportunities.
Here is Ethereum:
Or Crude Oil:
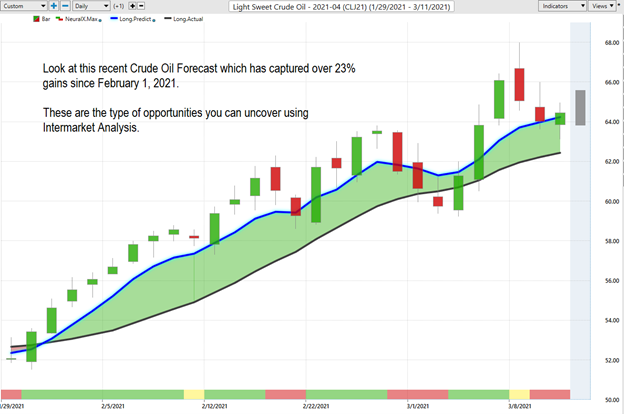
Small changes in Interest rates, Crude Oil Prices, and the Volatility of the dollar amongst thousands of other variables affect the decisions companies must make to survive in these very challenging times. Trying to determine what these factors are is one of the huge problems facing investors and traders.
The Final Word
Bitcoin has been the best performing asset of all time. Successful traders are not interested in arguing economic principles with anybody. Our purpose is to find the strongest trend and stay on the right side of that trend as long as possible. That is how money is made. Anything else is a fatal distraction.
There is a major difference between investing and trading.
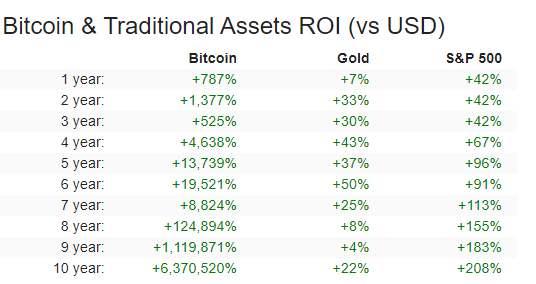
If you are an investor interested in Bitcoin my suggestion is to take the time to study and understand what makes Bitcoin unique. It all starts by asking the question, “What is money?” However, as traders, our time horizon is much shorter. We are looking at days to weeks whenever we trade an asset like Bitcoin. The following performance chart of Bitcoin, gold and the S&P 500 should pique your interest in wanting to learn more.
Artificial intelligence is invaluable for traders today because it clearly identifies the trend, the value zone, the anticipated price forecast and the risk on each and every trade. Plus, by using the intermarket analysis you can find other trading gems. Practicing good money management is essential on all of your trades.
Let’s Be Careful Out There!
Remember, It’s Not Magic.
It’s Machine Learning.

IMPORTANT NOTICE!
THERE IS SUBSTANTIAL RISK OF LOSS ASSOCIATED WITH TRADING. ONLY RISK CAPITAL SHOULD BE USED TO TRADE. TRADING STOCKS, FUTURES, OPTIONS, FOREX, AND ETFs IS NOT SUITABLE FOR EVERYONE.
DISCLAIMER: STOCKS, FUTURES, OPTIONS, ETFs AND CURRENCY TRADING ALL HAVE LARGE POTENTIAL REWARDS, BUT THEY ALSO HAVE LARGE POTENTIAL RISK. YOU MUST BE AWARE OF THE RISKS AND BE WILLING TO ACCEPT THEM IN ORDER TO INVEST IN THESE MARKETS. DON’T TRADE WITH MONEY YOU CAN’T AFFORD TO LOSE. THIS ARTICLE AND WEBSITE IS NEITHER A SOLICITATION NOR AN OFFER TO BUY/SELL FUTURES, OPTIONS, STOCKS, OR CURRENCIES. NO REPRESENTATION IS BEING MADE THAT ANY ACCOUNT WILL OR IS LIKELY TO ACHIEVE PROFITS OR LOSSES SIMILAR TO THOSE DISCUSSED ON THIS ARTICLE OR WEBSITE. THE PAST PERFORMANCE OF ANY TRADING SYSTEM OR METHODOLOGY IS NOT NECESSARILY INDICATIVE OF FUTURE RESULTS. CFTC RULE 4.41 – HYPOTHETICAL OR SIMULATED PERFORMANCE RESULTS HAVE CERTAIN LIMITATIONS. UNLIKE AN ACTUAL PERFORMANCE RECORD, SIMULATED RESULTS DO NOT REPRESENT ACTUAL TRADING. ALSO, SINCE THE TRADES HAVE NOT BEEN EXECUTED, THE RESULTS MAY HAVE UNDER-OR-OVER COMPENSATED FOR THE IMPACT, IF ANY, OF CERTAIN MARKET FACTORS, SUCH AS LACK OF LIQUIDITY. SIMULATED TRADING PROGRAMS IN GENERAL ARE ALSO SUBJECT TO THE FACT THAT THEY ARE DESIGNED WITH THE BENEFIT OF HINDSIGHT. NO REPRESENTATION IS BEING MADE THAT ANY ACCOUNT WILL OR IS LIKELY TO ACHIEVE PROFIT OR LOSSES SIMILAR TO THOSE SHOWN.

