The Golden Sunrise
The essential morning read for investors!
Golden Sunrise is the Golden Surveyor’s broad-based market and world view.
Written daily 4am-7am by markets information specialist GS John!

Today’s Golden Sunrise
Monday, May 03, 2010
Hours of daily research consolidated for you
Blue Monday?
April is generally considered to be a pretty good month in the Markets and it was..across the board..with weaknesses showing in places.
|
Market |
LDMar |
LDApr |
ChangeMon |
%changeM |
|
Japan-Tpx |
978.81 |
987.04 |
8.23 |
0.841% |
|
HongKong |
21,279 |
21108.59 |
-170.41 |
-0.801% |
|
Shanghai |
3109 |
2870.51 |
-238.49 |
-7.671% |
|
Taiwan |
7920 |
8004.25 |
84.25 |
1.064% |
|
South Korea |
1693 |
1741.56 |
48.56 |
2.868% |
|
Australia |
4876 |
4897.4 |
21.4 |
0.439% |
|
India |
17609 |
17588.71 |
-20.29 |
-0.115% |
|
India |
2,910 |
2974.61 |
64.61 |
2.220% |
|
|
|
|
|
|
|
UK-FTSE |
5680 |
5529.29 |
-150.71 |
-2.653% |
|
Germany |
6154 |
6136.7 |
-17.3 |
-0.281% |
|
France |
3974 |
3816.99 |
-157.01 |
-3.951% |
|
|
|
|
|
|
|
|
|
|
|
|
|
DJIA |
10,857 |
11008.61 |
151.61 |
1.396% |
|
S&P500 |
1169.43 |
1186.69 |
17.26 |
1.476% |
|
NasComp |
2397.6 |
2461.19 |
63.59 |
2.652% |
|
NDX100 |
1958.34 |
2000.63 |
42.29 |
2.159% |
|
R2000 |
678.64 |
716.6 |
37.96 |
5.594% |
|
NYSE |
7448 |
7474.4 |
26.4 |
0.354% |
|
Tran |
4375 |
4670.72 |
295.72 |
6.759% |
|
Util |
379 |
387.95 |
8.95 |
2.361% |
|
|
|
|
|
|
|
Canada-TSX |
12,030 |
12210.7 |
180.7 |
1.502% |
|
TSX Venture |
1577 |
1673.8 |
96.8 |
6.138% |
|
Brazil |
70,372 |
67530 |
-2842 |
-4.039% |
|
|
|
|
|
|
|
Gold |
1113.3 |
1180.7 |
67.4 |
6.054% |
|
Silver |
1752.6 |
1861.1 |
108.5 |
6.191% |
|
Copper |
355.35 |
333.75 |
-21.6 |
-6.079% |
|
Crude Oil |
83.33 |
86.15 |
2.82 |
3.384% |
|
Natural Gas |
3.886 |
3.92 |
0.034 |
0.875% |
|
CRB Index |
273.34 |
277.71 |
4.37 |
1.599% |
|
|
|
|
|
|
|
$index |
81.29 |
81.99 |
0.7 |
0.861% |
|
Euro |
1.3497 |
1.3308 |
-0.0189 |
-1.400% |
|
Yen |
1.0705 |
1.0651 |
-0.0054 |
-0.504% |
|
|
|
|
|
|
|
VIX |
17.59 |
22.05 |
4.46 |
25.355% |
|
VXN (Nas) |
18.32 |
22.06 |
3.74 |
20.415% |
|
VXV (S&P) |
19.92 |
23.67 |
3.75 |
18.825% |
|
RVX(R2000) |
22.76 |
28.34 |
5.58 |
24.517% |
On the month, the dollar was stronger but so were gold, commodities and the US stock markets which may be signaling a change in a pattern that has existed for months now.
Growth engines China and Brazil did not fare well in April. Nor did Dr. Copper which is another harbinger of growth.
The various volatility indicators are all up dramatically from the close of March markets but the spike was all generated in the last few days in April.
Coming into Monday, the first trading day of a new month, when cash again flows into 401ks and pension funds, following 2 big down days last week, and a negative week across the board (I will post the weekly data tables tomorrow for the week just passed-be sitting down-it is ugly), if the pattern of recent months continues, this should be a field day for buyers of dips. Mondays have been unusually positive for months now and first Mondays have been even better.
Those that peeked at their account balances on Friday or over the week-end saw that April had been a very nice month in their accounts and may feel pretty good coming into May. The “sell in May and go away” shibboleth has been met with a barrage of publicity telling you that 34 of last 59 Mays have been a pretty good months.
The data Friday was pretty chirpy.
- US GDP for Q1 came in about as expected at a plus 3.2%
- The jobs report on Thursday showed some slight improvement
- The Chicago PMI rose from 58.8 to 63.8 far better than expected.
- The Univ of Mich consumer sentiment rose from 69.5 to 72.2 far better than expected.
Lots of talk of raising taxes casting a shadow over the festivities.
- It will not be a VAT-the 45% of people who do not pay taxes now will then be paying tax on every cent they spend and many are barely making it now.
- It will not be a national sales tax for the same reason.
- It will fall on people who participate in stock markets
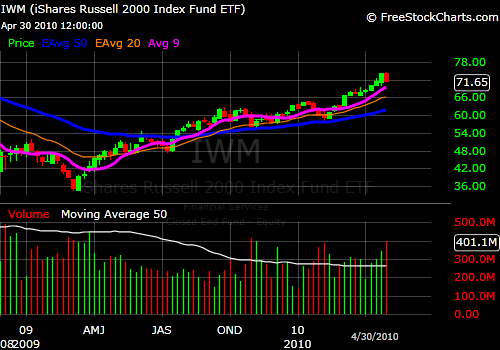
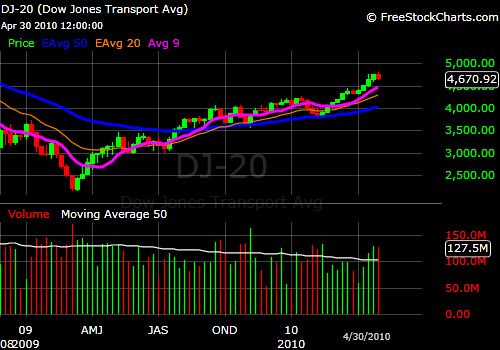
The charts here are weekly and reflect the areas have led the gains.
The Russell 2000 has been spectacular. The chart includes a 9MA so see if it serves as support on a correction.
The Transports have been as well-
An area of strength..and one of the very few-has been gold and we all know the reasons why so I won’t puke them up again.
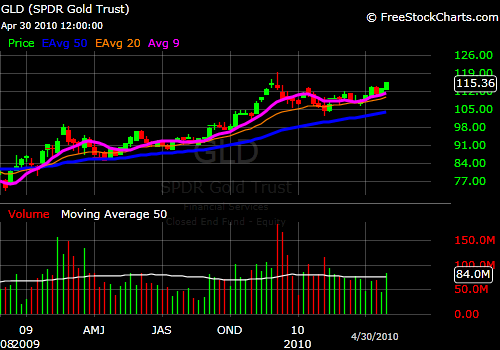
Gold is often subject to the sell in May and go away syndrome. Many times it rallies to mid-month , corrects and becomes dirt cheap in August-September. The gold stocks came off Friday afternoon in an interesting development.
Some additional data points:
- The bull/bear ratio at 54/18 is 3.00-unusually high
- The Rydex etfs have 7.3x the number $ going to bullish funds…
- Fund manager cash at 3.4% is the lowest in years.
- That means, other than today’s inflows, not much to buy with
- Not much for redemptions either if John Q decides to redeem
- JohnQ has put 73% of his contributions into bonds over the last year.
More ominous: Australia is going to hit its’ mining companies with a 40% tax-details unclear-mighty BHP was down 3.3% on the ASX last night…as were the other Aussie miners
- Mining stocks were getting hammered on the FTSE this morning as well…Europe all red but the London is down 1.15%
- Warren Buffet is on CNBC saying that based on what he knows that GS did not commit fraud. Based on what I personally, directly know, neither did Bernie M.
- Seven (7) banks were closed this week-end: much larger than the 7 closed last week-end. Three were in Puerto Rico and encompass 20% of the island’s deposits. The total assets of the sad 7 were $25.8B, deposits $19.6B. cost to the FDIC will be $7.33 billion..a serious drain on their reserves…the $45B in pre-paid charges to banks for the period 2010-2012 is almost gone. The prior 57 closings costs the FDIC $8.6B so this weeks “action” was not good.
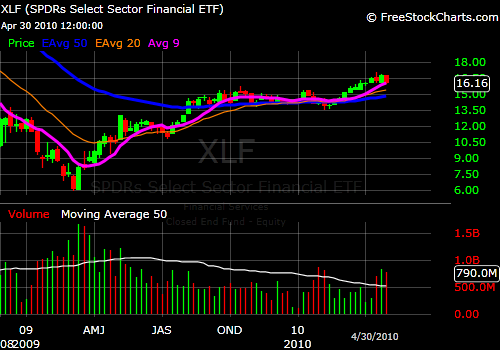
The XLF: probably worth watching if you think (like many) that the market can’t really go anywhere without them. Again, weekly.
Oil spills, volcanic interruptions of travel and commerce, earthquakes, sovereign debt crises, militant public sector unions, financial fraud…over the last 6 months this market has shrugged off repeated and on-going instances of all of these.
The last 6 months have been the best six months for the market as a group and the period starting with May has been the worst. The return differences between the two periods has been amazing.
Different this time?
Asia was down, Europe is down, US $, gold and future are up.
Maybe.
JohnR
Goldensurveyor.com