In the past three commentaries I have been explaining how the work of George Lindsay forecast the October 5, 2012 high in the Dow. This week, I was to expand on last week’s explanation of the 12 year interval to forecast the bottom of the next bear market in the Dow. As several equity indices have made new highs in the past week I thought it best to take another look at that set up for a high last October.
Two points are important to note.
- Lindsay very specific that his methods were meant to be used on the Dow index and that their use on broader indices (i.e. S&P 500) should not be expected to be successful.
- The intra-day high in the Dow on 10/5/12 at 13,661.87 has not been exceeded as of last Friday.
When forecasting a market high with the methods of George Lindsay, the first step is always the 15-year interval . A period of time which should contain the high we seek is identified by counting from an important low to a time period 15 years to 15 years and 11 months later. Counting from the low of October 1997 identifies such a time period between October 2012 and September 2013.
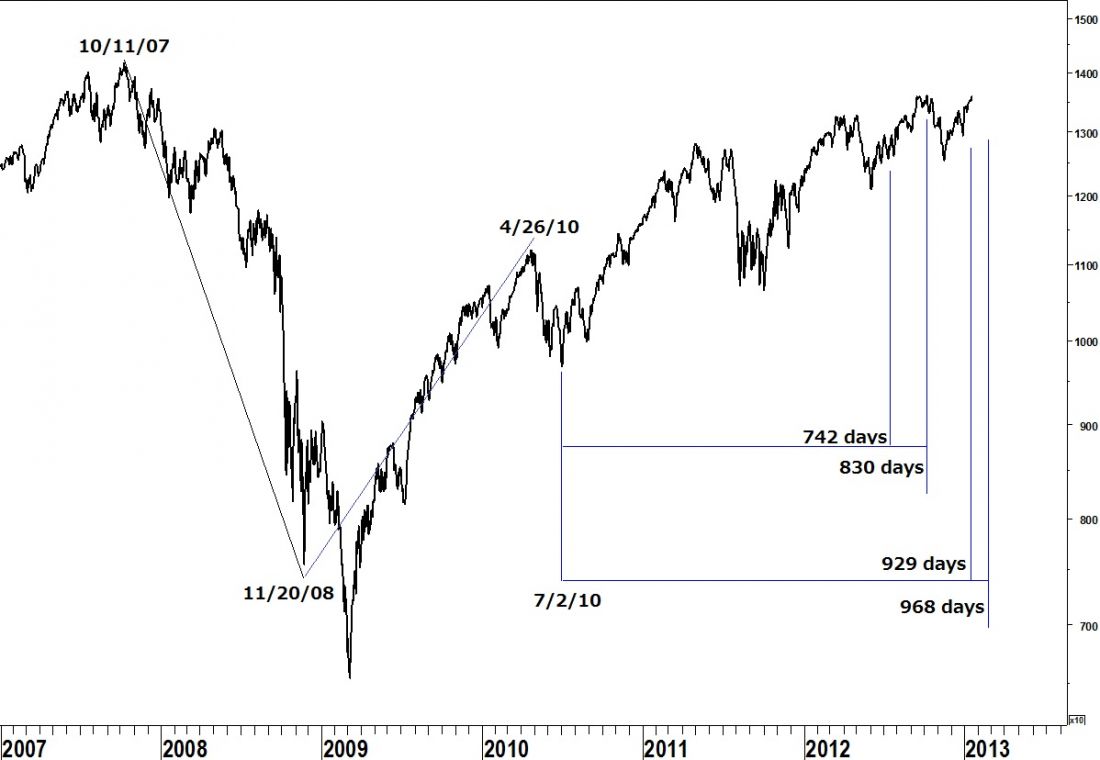
After the bull market high in October 2007 the Dow declined for 13 months, until November 2008 when it marked a temporary low. The Principle of Continuity directs us to count the next advance from this “secondary low” rather than the ultimate low in March 2009 as 13-14 months is the time span of a long basic decline. A complete listing of Lindsay’s standard time spans can be found at Seattle Technical Advisors.com. We always begin counting the next basic advance where the previous basic decline ended.
Counting from a descending middle section in January 2005 to the bull market high in October 2007 is 1002 days. The July 2, 2010 low follows the 2007 high 995 days later making this the bottom of a basic cycle. We would expect to count a basic advance from this low which means the advance from the November 2008 low must have ended at the April 2010 high.
The advance between the November 2008 low and the April 2010 high was 498 days. 498 days fits into the time span of a subnormal basic advance. The Principle of Alternation guides us to expect the next advance (off the July 2010 low) to be either long or extended.
A long basic advance (742 – 830 days) targets the time period between July 13 and October 9, 2012 for an end to the bull market. An extended basic advance (929 – 968 days) targets the time period between January 16 and February 24 for the high.
An ascending middle section targeted a high on October 7, 2012. Please refer to my October 8, 2012 commentary for details.
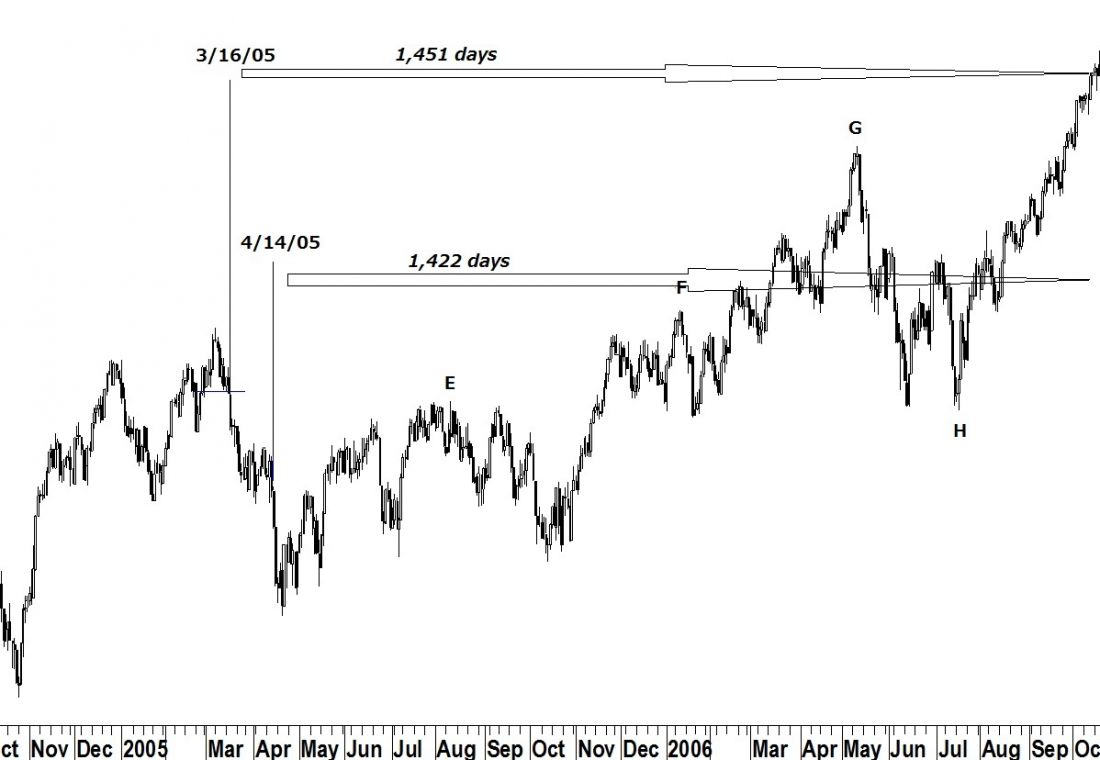
A middle section from early 2005 has two possible measuring points; point C on 4/14/05 counts 1,422 days to the major low on 3/6/09. This Friday, 1/25/13 is 1,421 days after the 2009 low. Another possible point C on 3/16/05 counts 1,451 days to the March 2009 low. Counting an equidistance forward targets a possible high on 2/24/13. Both counts fit the period identified by an extended basic advance and the 15-year interval. A move by the Dow industrials to a level higher than the 10/5/12 high should be on its way to a high on, or near, either one of these dates.