
.jpg)
One of the ongoing themes which I am forced to confront regularly as I look at the world financial markets is the Federal Reserve. Last week I wrote about how they discontinued the publication of M2 Money Supply figures which I have found to be very troubling. Cheerleaders for the Fed seem to evaluate all actions which the Fed engages in, as necessary. Critics are very concerned about a currency devaluation which normally accompanies the large amount of new money which has been created in the past year.
Here are a couple of important metrics worthy of every trader’s evaluation. On January 3, 2009, the inventor of Bitcoin, Satoshi Nakamoto, posted on the Genesis block of the brand-new cryptocurrency blockchain the following message and warning:
“The Times 03/Jan/2009 Chancellor on brink of second bailout for banks”
This post was referencing the following headline and article in the Financial Times Newspaper.
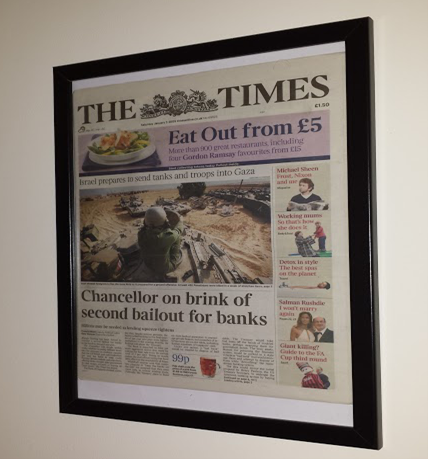
What is critical to understand was that the article was referencing a 50 billion British Pounds infusion of money into the British banking system to keep it solvent during the Great Financial Crisis. Currently, the United States, before it discontinued the publication of the M2 Money Supply figures was producing that much money every four days!
Context is critical in our decision-making process. We must always evaluate the circumstances that form the setting for an event, statement, or idea, so it can be fully understood and assessed. Unfortunately, we are in uncharted waters when it comes to seeing the explosion of Central Bank balance sheets and Government deficits witnessed in the last 12 to 15 months.
At the height of the Great Financial Crisis, we thought that the world was ending when the Federal Reserve added $600 billion to the financial markets. Today, they have added more than 6 times as much and since the world has not ended, we seem grateful for the Fed’s prowess in safeguarding us from financial harm.
The Fed has not only been adding huge amounts of new money into the financial system they have been buying all government debt for the last several years. In September 2019, the Feds balance sheet was at $3.8 trillion. This was the entirety of government bonds they purchased since the Fed was chartered in 1913. So, in the first 106 years of their existence, they purchased $3.8 trillion of Treasury debt. Then, in just the last 18 months that amount has more than doubled and now stands at $7.8 trillion. That level of exponential growth is worrisome to say the least.
I am not mentioning these facts because they are big scary numbers. I am mentioning them because as the Fed steps in to “handle the situation” and protect us from financial harm it is dealing a death blow to free markets and creating a completely artificial economy. These figures represent interventions in the financial markets which are massively extreme and always create incredible pricing distortions. Since the Fed is buying $150 billion dollars a month of Treasury securities, what happens to markets if that should ever stop? How long can that continue? What happens to the purchasing power of the dollar in the interim?
A simple way of visualizing this is studying the following chart of the US GDP created by the St. Louis Federal Reserve Bank.
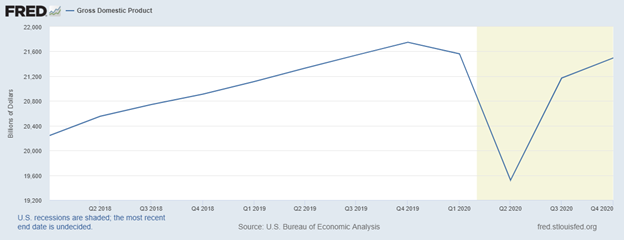
In the fourth quarter of 2019 the US GDP stood at $21,433 billion. As the economic lockdown and COVID-19 hit the economy in 2020 the GDP contracted to $19,520 billion. The GDP of a country is calculated by adding the following figures together: personal consumption; private investment; government spending; and exports (less imports). Over this time frame government spending was $7 trillion and it still has not returned to is q4 highs. The point I am making is that even the GDP figure has become a completely artificial number which masks the true health of the real economy.
In the past, Gross Domestic Product tracked the health of a country’s economy. It represented the value of all goods and services produced over a specific time period within a country’s borders. Economists and traders would use GDP to determine whether an economy was growing or experiencing a contraction. But when government spending becomes the key primary component of GDP. What exactly are we measuring? Better stated, what truth are we avoiding? Is this why government politicians and bureaucrats are now promoting spending programs that total more than $11 trillion?
The economy has been showered in free helicopter money from the Fed and now economists conflate government spending with real economic production.
The key question moving forward is how long can this go on for? What does GDP look like if Federal spending has to retract to amounts of less than $7 trillion per year?
In general, the following simplified equation is often employed to calculate a nation’s GDP via the expenditure approach:
GDP=C+G+I+NX
C=Consumption
G=Government spending
I=Investment
NX=Net exports
Since the Fed has decided not to publish Money Supply figures any longer what is next? Do they stop publishing GDP numbers because citizens will quickly see that the only reason that GDP has not contracted 25% is because the FED is spending at hyperinflationary levels?
Many traders are worried about inflation. It feels like this debate is the most important conversation in finance right now. If interest rates creep up from current levels the interest payments on the existing government debt increase exponentially and suffocate real economic production.
The interesting angle to the inflation debate that everyone forgets though is whether high inflation ever comes or not doesn’t actually matter. The reality of markets is that the FEAR of inflation is what ultimately drives capital flows. When traders are nervous about inflation, they begin to acquire store of value and inflation-hedge assets. In the past, those assets have included real estate, precious metals, and various alternative assets like expensive art. Take a look at the real estate market where you live and decide for yourself if inflation is returning. Where I live prices are sky rocketing.
Fear of inflation is present, and it is the driving force in the markets right now. We have seen eleven plus years of quantitative easing at zero interest rates get us to this juncture. On the other hand, we have Fed Chairman Jerome Powell explicitly state that the Federal Reserve won’t act on rising inflation until it is rising beyond its historical target.
Can the Fed print prosperity?
Is it possible to print trillions of dollars and not see higher levels of inflation? Traders believe the Fed is actually going to do whatever it takes to drive inflation much, much higher. You can think of this as a self-fulfilling prophecy on the part of market participants.
The bottom line is that traders front run the inflation they see coming. They will move capital into inflation-hedge assets. And those inflation hedge assets will continue to rise. Hopefully, the Fed will be able to control the inflation once it gets up above 2% or 3% level.
Since the beginning of the year, we have seen the Commodity Research Bureau Index climb by over 20%.
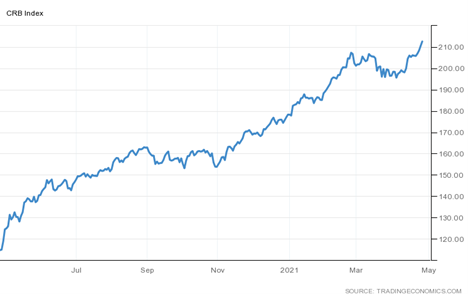
Lumber prices are up 100%.
Corn prices up 35%.
Copper prices are up 25%
In the current economic environment financial assets must go up. They are not allowed to go down. “Bear markets are bad.” This is the logic that prevails today. It doesn’t matter how overvalued assets get.
Nobody knows how to navigate this environment using traditional analytical models. Hundreds of years of sound money, traditional finance and economics have been thrown overboard. Welcome to the new American dream. Liquidity is everywhere and it has flown to financial assets resulting in huge increases. If our ancestors would have only known about Quantitative Easing they would’ve never had to work. The Fed will take care of us. Interest Rates will always stay at Zero. Debt be damned.
The headlines are screaming the biggest GDP expansion in the history of our country. Traders who don’t even know how the GDP is calculated take the news and go ALL IN! But if you take government spending out of that equation what does the rest of the economy look like?
What could go wrong?
Traders should brace themselves for some serious volatility.
When Warren Buffet, one of the greatest investing legends in the world returns 1.6% on his fund, with a 30+% drawdown it should clearly indicate that change is happening faster and faster. Traders who can adapt will be handsomely rewarded. Buy and hold investors, like Buffet, are in for a wild ride.
If you understand that we are living in a Brave New Financial World you also understand you need new tools to make sense of the madness. Interest Rates are being pushed to negative territory around the world in the “hopes” that it will stimulate economic growth. Last I checked there were $18 trillion dollars of negative yielding Treasury Bonds in the world. It’s anybody’s guess as to how much malinvestment has occurred over the past 18 months which always is a drag on the economy.
These two factors clearly show how much the world has changed.
What traders need is a solution that takes these massive distortions into effect and delivers statistically sound decision making.
How do you find the right trend at the right time, day in and day out?
Successful traders are obsessed at finding solid trends. This is what Vantagepoint specializes in. To prove it to you check out this recent chart of the S&P 500 Index.
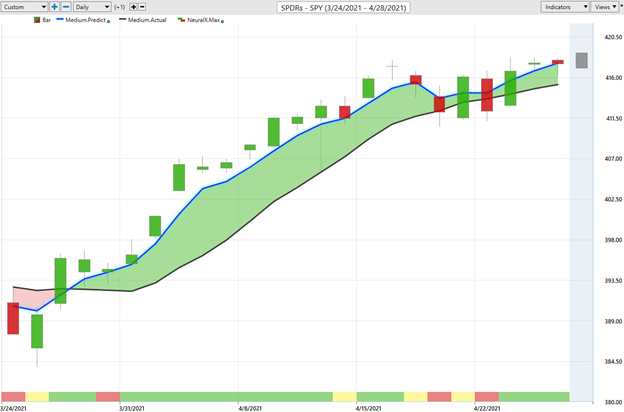
While the talking heads in the media were forecasting a bear market recently the A.I. created an up forecast on 3/26/21 and the market has rallied over 6.5% in that time frame.
How good are you at making decisions?
What has your performance been this year?
What’s Your Best Chance to Make Money In The Financial Markets Today?
The Answer A.I. Offers Will Surprise You. Intrigued?
You too can start finding the best trend at the right time regardless of your experience.
After all a.i. has beaten humans at Poker, Chess, Checkers, Jeopardy and Go. Why should trading be any different?
Intrigued? Visit with us and check out the A.I. at our Next Live Training.
Discover why artificial intelligence is the solution professional traders go-to for less risk, more rewards, and guaranteed peace of mind.
It’s not magic. It’s machine learning.
Make it count.

IMPORTANT NOTICE!
THERE IS SUBSTANTIAL RISK OF LOSS ASSOCIATED WITH TRADING. ONLY RISK CAPITAL SHOULD BE USED TO TRADE. TRADING STOCKS, FUTURES, OPTIONS, FOREX, AND ETFs IS NOT SUITABLE FOR EVERYONE.
DISCLAIMER: STOCKS, FUTURES, OPTIONS, ETFs AND CURRENCY TRADING ALL HAVE LARGE POTENTIAL REWARDS, BUT THEY ALSO HAVE LARGE POTENTIAL RISK. YOU MUST BE AWARE OF THE RISKS AND BE WILLING TO ACCEPT THEM IN ORDER TO INVEST IN THESE MARKETS. DON’T TRADE WITH MONEY YOU CAN’T AFFORD TO LOSE. THIS ARTICLE AND WEBSITE IS NEITHER A SOLICITATION NOR AN OFFER TO BUY/SELL FUTURES, OPTIONS, STOCKS, OR CURRENCIES. NO REPRESENTATION IS BEING MADE THAT ANY ACCOUNT WILL OR IS LIKELY TO ACHIEVE PROFITS OR LOSSES SIMILAR TO THOSE DISCUSSED ON THIS ARTICLE OR WEBSITE. THE PAST PERFORMANCE OF ANY TRADING SYSTEM OR METHODOLOGY IS NOT NECESSARILY INDICATIVE OF FUTURE RESULTS. CFTC RULE 4.41 – HYPOTHETICAL OR SIMULATED PERFORMANCE RESULTS HAVE CERTAIN LIMITATIONS. UNLIKE AN ACTUAL PERFORMANCE RECORD, SIMULATED RESULTS DO NOT REPRESENT ACTUAL TRADING. ALSO, SINCE THE TRADES HAVE NOT BEEN EXECUTED, THE RESULTS MAY HAVE UNDER-OR-OVER COMPENSATED FOR THE IMPACT, IF ANY, OF CERTAIN MARKET FACTORS, SUCH AS LACK OF LIQUIDITY. SIMULATED TRADING PROGRAMS IN GENERAL ARE ALSO SUBJECT TO THE FACT THAT THEY ARE DESIGNED WITH THE BENEFIT OF HINDSIGHT. NO REPRESENTATION IS BEING MADE THAT ANY ACCOUNT WILL OR IS LIKELY TO ACHIEVE PROFIT OR LOSSES SIMILAR TO THOSE SHOWN.

