
AutoZone, Inc. is an American retailer of aftermarket automotive parts, and accessories, the largest in the United States. They are also recognized as the largest Auto parts store in the world. Founded in 1979, AutoZone has over 6,400 stores across the United States, Mexico, Puerto Rico, and Brazil. The company is based in Memphis, Tennessee.
Since October 1995, AutoZone has been headquartered in its J.R. Hyde, III Store Support Center, a 270,000-square-foot, eight-story building in Downtown Memphis, Tennessee. They have over 96,000 employees internationally and generate 13.4 billion dollars annually.
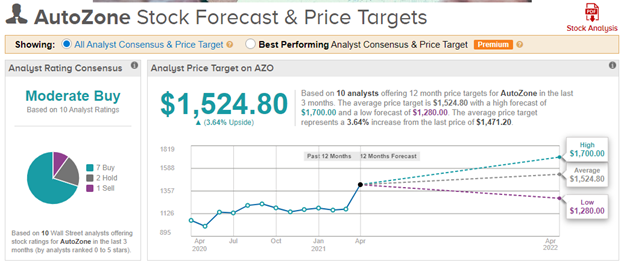
Based on 10 analysts offering 12-month price targets for AutoZone in the last 3 months. The average price target is $1524.80 with a high forecast of $1700.00 and a low forecast of $1280.00. The average price target represents a 3.76% increase from the current price of $1470. Power Traders like to see this wide divergence in opinion among analysts as it creates great trading opportunities when the artificial intelligence creates a trend forecast. Most analyst’s think that the long-term FAIR Value zone on the stock is around $1140.
For AutoZone’s second quarter, which ended Feb. 13, they reported excellent same-store sales growth of 15.2%, demonstrating that the company had recovered from the pandemic’s impact. The economic climate today looks positive for auto parts retailers. An economic recovery is occurring, accompanied by stronger than normal GDP growth and the return of warm spring weather usually leads to an increase in the number of vehicle miles driven, which in turn leads to higher demand for auto parts. Analysts have been revising their growth estimates upward on the company based upon their stellar first quarter performance.
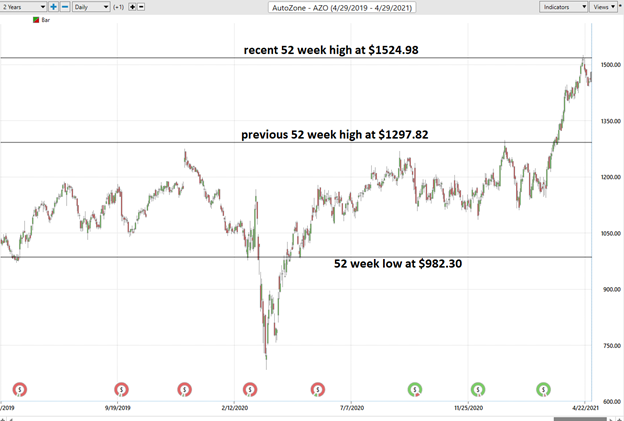
Over the last 52 weeks AZO has traded as high as $1524.98 and as low as $982.30. This provides us with an annual trading range of $542.68. When we divide this metric by 52 weeks, we can determine that the average weekly trading range for AZO is roughly $10.43. We refer to these as the commonsense metrics which we use as baseline measurements of understanding normal value. When using artificial intelligence, we look to amplify our returns based upon these baseline measurements and our average holding period.
AutoZone has a powerful industry-leading position, a growing business, but it has underperformed the major market indexes. Over the past 12 months AZO is up 37.36% while the S&P 500 in up 41.59%. On the positive side its Price to Earnings Ratio is 18.2 while the rest of the market is 21.3. This by itself implies that it is undervalued in comparison to the rest of the market. Over the past 5 years earnings have grown by 8.7% per year. Over the next three years, earnings are forecasted to grow at 4.13%. Their net profit margins average 14%.
The major concern that analysts have with AZO is that the company has a high level of debt. The company’s liabilities exceed its assets although it is easily serviced by its operating cash flow. What also weighs on the company’s future growth prospects is that new vehicle sales for 2020 and 2021 have been quite sluggish. This has been caused by the economic lockdowns and pandemic which has caused people to drive less in their cars.
On average the company trades average volume of 232,632 shares per day and is widely held by Mutual Funds, ETF’s, and Hedge Funds.
Whenever we trade, we always pay attention to where we are in relation to the 52-week trading range. It is very common to see the 52-week high provide very strong resistance to the market until it is breached. Often when the 52-week high is breached we will see the stock price explode higher very quickly over a very short period of time. Placing stocks that have made new 52-week highs on your trading radar is a very valuable thing to do.
Here is the chart of AZO over the past two years. Notice how until recently simply trading a breach of the 52-week high would see profits accumulate very quickly. Most recently AZO encountered resistance at its most recent 52-week high.
Whenever we look at a stock forecast, we always are comparing what the stock has done, to the artificial intelligence, which is computing its forecast based upon a proprietary intermarket analysis of the most closely correlated assets as well as a neural network computation.
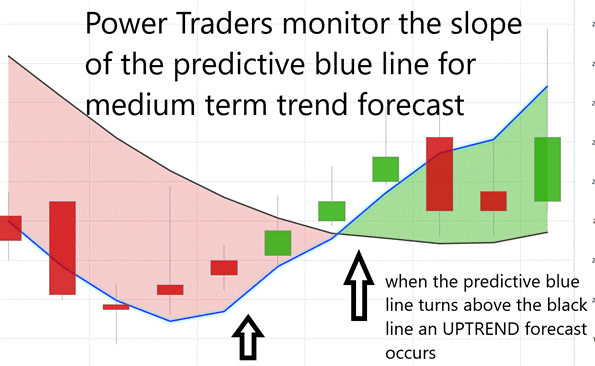
The key to the Vantagepoint analysis is the predictive blue line. The slope and general direction of the blue line determines the medium forecast for the market.
The Vantagepoint Software has three separate modules which create a forecast for a Power Trader. They are the predictive blue line, the Neural Net, and the Intermarket Analysis.
The software focuses on the daily price action. You’ll see that there’s a black line and also a blue line right up against the price data on the chart.
The predictive blue line also acts as value zone where in uptrends traders try to purchase the asset at or below the blue line.
In studying the AZO chart above pay close attention to the relationship between the black line and predictive blue line. All that the black line tells you is what has occurred. It tells you where prices have been and what the average price over the last ten days has been. Your challenge now is to try and fine tune your entries so you can try to purchase at or below the predictive blue line in an uptrend.
The predictive blue line utilizes that Vantagepoint patented Neural Network and Intermarket Analysis to arrive at its value. It looks at the strongest price drivers of an asset through artificial intelligence and statistical correlations to make a statistically sound trend forecast.
Power traders use the predictive blue line in helping to determine both the value zone as well as the trend direction.
The black line that you see that is a regular simple 10 period moving average. A very common technical indicator. And it’s a good measure to go ahead and smooth out the price data and it gives us an indication of where market prices have been over a given period of time. But obviously as traders we really need to understand is where our market price is moving going forward.
So, what we want to do is compare that black line value on the chart to the predictive blue line, which is Vantagepoint’s predictive indicator. What it does is Vantagepoint is utilizing its technology to perform what’s called intermarket analysis. So that means that there’s known relationships as far as those neural networks are concerned that affect and drive the future price of Waste Management. That’s going to be things like the S&P 500 or the Russell 2000 or the NASDAQ. That’s going to be things like global currencies or global interest rates, or futures and commodity markets.
Here is a chart of just the predictive blue line accompanied by the simple 10 day moving average – the black line.
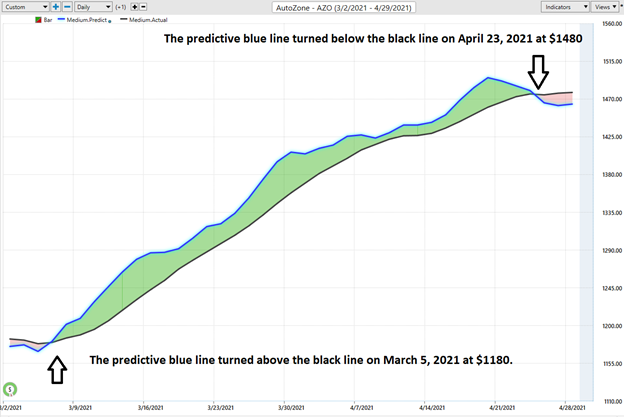
Observe how the SLOPE of the predictive blue line started moving higher a few days previous to its moving above the black line.
Here is the same chart with the accompanying daily price bars. As you look through this chart study how Power Traders always try to purchase the stock at or below the predictive blue line, as that is considered to be the IDEAL VALUE zone for traders.
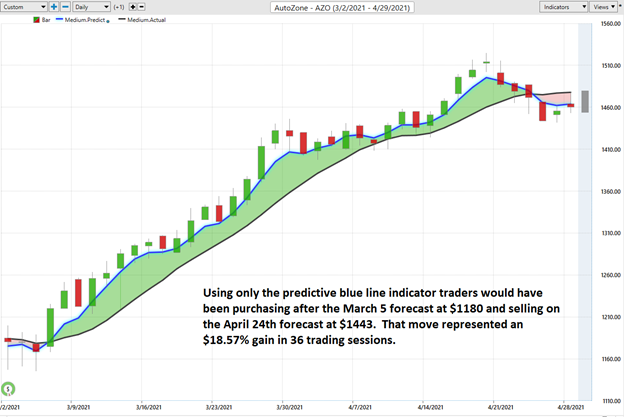
Over a timeframe of 36 trading sessions AZO climbed over 18.57%.
The artificial intelligence in the Vantagepoint Software focuses on intermarket relationships to make its price forecasts. It’s actually generating future price predictions of where prices are likely to move, and utilizing these predictions that you see against the charts. So, turning what was a lagging tool (the ten-day moving average) into a forward-looking predictive tool.
So, whenever we have this blue line crossing above the black line its really suggesting average prices are expected to start moving higher and you therefore would likely look for long positions in the market.
Fine Tuning Entries with The Neural Net Indicator
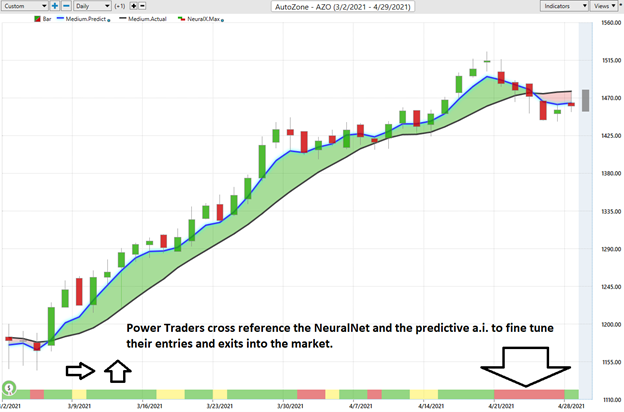
At the bottom of the chart is the Neural Network Indicator which predicts future strength and/or weakness in the market. When the Neural Net Indicator is green it communicates strength. When the Neural Net is red it is forecasting short term weakness in the market. When the Neural Net is yellow it is forecasting sideways price action.

We advocate Power Traders cross reference the AZO chart with the predictive blue line and neural network indicator to create optimal entry and exit points.
Power Traders are always looking to apply both the neural network and a.i. to the markets to find statistically sound trading opportunities. Here is a chart of AutoZone (AZO) with both indicators. You can quickly see why the predictive blue line determines the value zone for traders.
In summary, the trend turned up on 3/5/21. The price level was in the $1220 range at that particular time. Thirteen days later prices challenged the previous 52-week high at $1292 and successfully breached and closed above that price level running to new all-time highs in another two-week period of time.
Traders have had numerous opportunities to purchase AZO lower focusing on purchasing at or below the predictive blue line. Gains of 18.7%+ have been available to Power Traders who maintained positions throughout the entire trend cycle.
Daily Price Trading Range Forecast
And if you look at the very right-hand side of the chart, you’ll see that there is what we call a predicted shadow candle. And that’s actually a predicted high and a predicted low for the next trading day. So, you actually get an overall trend prediction, short-term strength, or weakness, and this predicted high and low. And what happens is you have these separate neural networks really doing all of this and looking at these different sorts of timeframes and creating a forward-looking analysis.
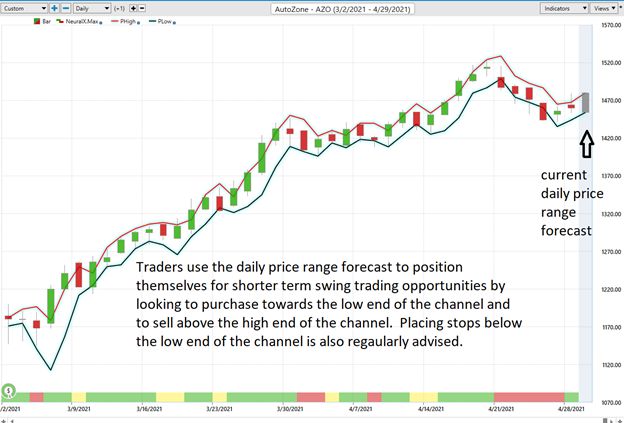
Power Traders try to use a price level below the predictive low price to place their protective sell stops in the market in case a sudden reversal was to occur. Observe how the predictive price low also provided numerous short term entry opportunities for traders to buy AZO as it was trending higher.
Intermarket Analysis
What makes Vantagepoint unique and distinct when compared to all other analytical tools is its patented and proprietary intermarket analysis.
Intermarket analysis is a method of analyzing markets by examining the correlations between different asset classes. In other words, what happens in one market could, and probably does, affect other markets, so a study of the relationship(s) is often very helpful to a trader.
Studying the charts can always provide objective realities in terms of locating support and resistance levels which become very clear on a chart. But we live in a global marketplace. Everything is interconnected. The billion-dollar question for traders is always what are the key drivers of price for the underlying asset that I am trading?
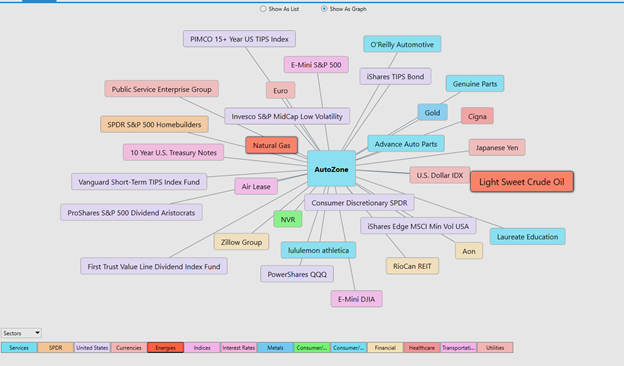
These intangibles are invisible to the naked eye yet are responsible for driving prices. These markets show very high statistical correlations. Looking at studying the intermarket analysis will uncover competitors as well as other sectors which are often poised to trend like the asset you are studying.
Instead of looking at financial markets or asset classes on an individual basis, intermarket analysis looks at several strongly correlated markets, or asset classes, such as other stocks, currencies, ETF’s, and commodities. This type of analysis expands on simply looking at each individual market or asset in isolation by also looking at other markets or assets that have a strong relationship to the market or asset being considered. The Vantagepoint software analyzes the top 31 drivers of an assets price. This analysis will often show ETF’s which are big owners of the underlying asset, but it will also uncover other markets which are statistically correlated to the trend you are analyzing. Traders often find other blossoming opportunities when engaging in Intermarket Analysis.
There is great value to be had in studying and understanding the key drivers of AZO price action.
Our suggestion – AZO has had a good run and we have it on our trading radar. The current trend forecast is for prices to move lower. Over 36 trading sessions we saw gains of 18.57%. We are interested in this stock at lower prices when the artificial intelligence signals that the trend is moving higher. Wall Street likes AutoZone stock because of its ability to grow during recessions and economic expansions. A further rally in shares will depend on AZO continuing to show market-beating sales growth. We will be watching the next earnings call slated for May 25, 2021.
The consensus of analyst’s opinions shows that AZO is fairly valued around $1524. We think the stock will look for support around $1435 and at present time we think it can exceed the high analysts estimate of $1700. The stock is marginally undervalued at present but we can find better risk to reward ratios in other stocks at present.
We have it firmly on the radar and look for opportunities as long as the A. I. forecast is UP.
Our advice: Follow the A.I. trend analysis, pay close attention to the daily price range forecast and look to buy lower at the lower end of the range. Practice good money management on all of your trades. AZO deserves to be on your trading radar.
Let’s Be Careful Out There!
Remember, It’s Not Magic.
It’s Machine Learning.

IMPORTANT NOTICE!
THERE IS SUBSTANTIAL RISK OF LOSS ASSOCIATED WITH TRADING. ONLY RISK CAPITAL SHOULD BE USED TO TRADE. TRADING STOCKS, FUTURES, OPTIONS, FOREX, AND ETFs IS NOT SUITABLE FOR EVERYONE.
DISCLAIMER: STOCKS, FUTURES, OPTIONS, ETFs AND CURRENCY TRADING ALL HAVE LARGE POTENTIAL REWARDS, BUT THEY ALSO HAVE LARGE POTENTIAL RISK. YOU MUST BE AWARE OF THE RISKS AND BE WILLING TO ACCEPT THEM IN ORDER TO INVEST IN THESE MARKETS. DON’T TRADE WITH MONEY YOU CAN’T AFFORD TO LOSE. THIS ARTICLE AND WEBSITE IS NEITHER A SOLICITATION NOR AN OFFER TO BUY/SELL FUTURES, OPTIONS, STOCKS, OR CURRENCIES. NO REPRESENTATION IS BEING MADE THAT ANY ACCOUNT WILL OR IS LIKELY TO ACHIEVE PROFITS OR LOSSES SIMILAR TO THOSE DISCUSSED ON THIS ARTICLE OR WEBSITE. THE PAST PERFORMANCE OF ANY TRADING SYSTEM OR METHODOLOGY IS NOT NECESSARILY INDICATIVE OF FUTURE RESULTS. CFTC RULE 4.41 – HYPOTHETICAL OR SIMULATED PERFORMANCE RESULTS HAVE CERTAIN LIMITATIONS. UNLIKE AN ACTUAL PERFORMANCE RECORD, SIMULATED RESULTS DO NOT REPRESENT ACTUAL TRADING. ALSO, SINCE THE TRADES HAVE NOT BEEN EXECUTED, THE RESULTS MAY HAVE UNDER-OR-OVER COMPENSATED FOR THE IMPACT, IF ANY, OF CERTAIN MARKET FACTORS, SUCH AS LACK OF LIQUIDITY. SIMULATED TRADING PROGRAMS IN GENERAL ARE ALSO SUBJECT TO THE FACT THAT THEY ARE DESIGNED WITH THE BENEFIT OF HINDSIGHT. NO REPRESENTATION IS BEING MADE THAT ANY ACCOUNT WILL OR IS LIKELY TO ACHIEVE PROFIT OR LOSSES SIMILAR TO THOSE SHOWN.

