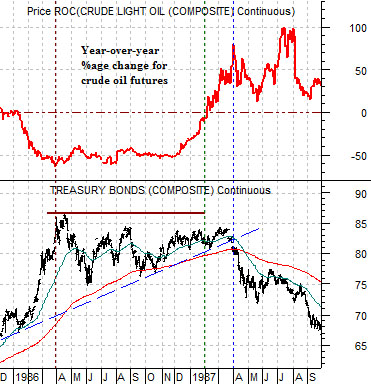
We are pulling forward a chart comparison that we showed in the back pages of yesterday’s issue to give it one last thrashing before setting it aside. The chart at top right compares the U.S. 30-year T-Bond futures with an annual percentage Rate of Change (ROC) indicator for crude oil futures prices from late 1985 into the autumn of 1987.
The stock market ‘crash’ in 1987 was really the end result of a sequence of markets trends that began years earlier. For our purposes today we are going to argue that the chain of events began with the break down by oil prices towards the end of 1985.
The year-over-year change for crude oil prices fell sharply down to -50% in early 1986 and held at that level into November. In response to falling oil prices the bond market lifted in price as reduced expectations with regard to inflation helped lower long-term Treasury yields.
The TBonds held near the highs through the last nine months of 1986 and into the first quarter of 1987. As the annual %age ROC for crude oil turned positive downward pressure began to be exerted on bond prices. Through 1986 rising bond prices drove most of the interest rate and consumer stock sectors higher and when the commodity markets began to rally in early 1987 almost everything pushed upwards. As stock prices rose bond prices fell and this divergence ultimately led to the stock market’s crash.
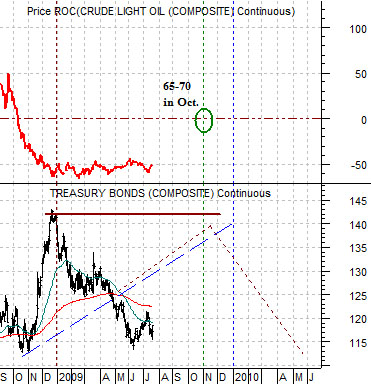
Anyway… the current situation appears somewhat similar to 1986 because the annual percentage Rate of Change for crude oil fell to -50% at the end of last year and has held at that level through into July.
The major difference has been that instead of the TBonds holding near the December price highs- as was generally the case through 1986- prices were forced all the way back to the last autumn’s lows.
One potential ‘path’ for the markets would involve an upward swing by the bond market back towards 140 followed by a return to a weaker trend once the year-over-year comparison for crude oil prices finally swung back above the ‘0’ line. To put this into perspective if crude oil prices did nothing more than hold at 65- 70 into the end of October the annual %age indicator would rise back into positive territory.
Equity/Bond Markets
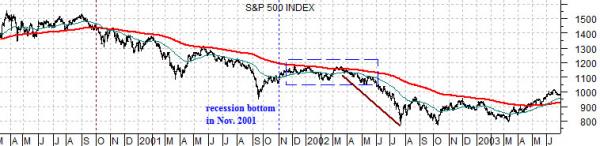
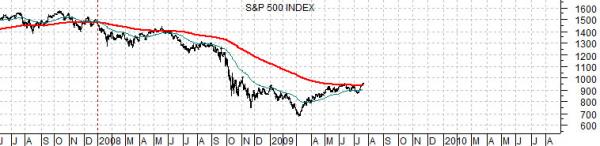
We will start off with the two charts below of the S&P 500 Index (SPX). The top chart runs from 2000 into 2003 while the lower chart begins in mid-2007.
The argument is that on a ‘time comparable basis’ the SPX is struggling with the 200-day e.m.a. line in roughly the same manner that it bumped up against this line in the spring of 2002. In other words… the markets today are somewhat similar to the second quarter of 2002 because the length of time from when the SPX broke down below its 200-day e.m.a. line (Sept. 2000 vs. December 2008) is roughly equivalent and the index is struggling with resistance at the 200-day moving average line.
If the SPX breaks above its moving average line then the point that we are going to attempt to make will be moot but if it doesn’t… then this may actually make sense
The first premise is that there are cyclical themes that trend with the dollar (tech, telecom, and biotech) and themes that trend inversely to the dollar (mainly commodities).
The second premise is that the dominant theme into the stock market peak in 2000 was ‘tech and telecom’ while the dominant theme into 2007 – 2008 was ‘commodity’.
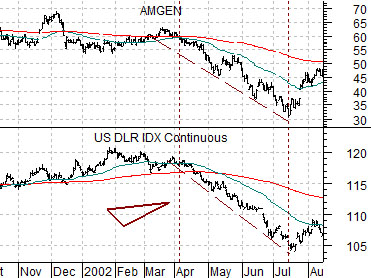
When the SPX failed at the moving average line in 2002 the markets ‘split’ with weakness developing in the trends that go with the dollar. We show Amgen and the U.S. Dollar Index (DXY) below.
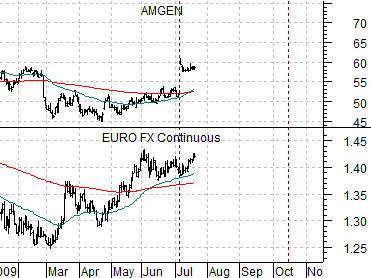
If the SPX fails at the moving average line in 2009 the argument would be that we should get a different outcome. If the biotechs and tech sectors are doing better then we are more likely going to see dollar strength and euro weakness. Why? Mostly because the markets tend to repeat but always in a different way. If the final down leg for the SPX in 2002 went with dollar weakness then there is a good chance that this time around it will involve weakness in some other major currency.