If one simply followed ‘the news’ it would be difficult, we suspect, to find a reason to be bullish on the cyclical sectors. We do believe, however, that the markets are setting up or, perhaps, in the process of making a cyclical pivot that will drive asset prices higher and bond prices lower. It may well be that this will become more (or less) clear following the end of this week’s 2-day Federal Open Market Committee meeting on Thursday.
The idea of ‘time and place’ brings us back to an argument that we have not used in quite some time. We can’t recall the last time we presented the idea of 5-year trends but it was a long time back.
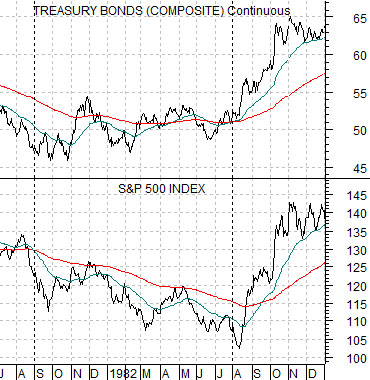
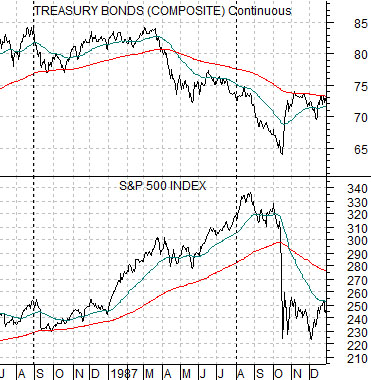
To set the stage we have included two comparative charts on this page. We will use most of pages 2 and 3 to show other examples. The charts at right feature the U.S. 30-year T-Bond futures and the S&P 500 Index with the top perspective coming from 1981- 82 and the lower view including the time frame from 1986- 87.
The bond market bottomed in price in the autumn of 1981.
The stock market bottomed out in August of 1982.
The argument is that trends tend to run for almost exactly five years and then change in some kind of meaningful way. The change is not always in the manner that one might expect but we can make a case that something of importance seems to happen within the markets at five year intervals.
The U.S. 30-year T-Bond futures peaked in August of 1986 just after crude oil prices reached bottom in July. With a bit of imagination we will suggest that the peak for bond prices in 1986 was made 5 years after the cycle bottom.
The pre-crash top for the S&P 500 Index was made in August of 1987. This was almost exactly five years from the start of the equity bull market in August of 1982.
Coincidence or not… the bond market reached a top five years after its bottom while the stock market traded up to the highs ahead of the 1987 ‘crash’ in the same month that it had pivoted upwards in 1982.
Equity/Bond Markets
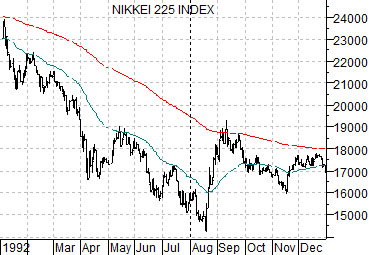
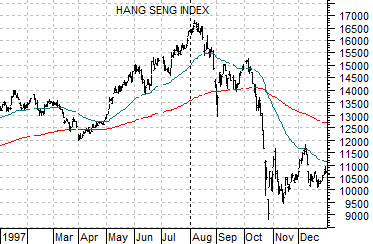
Below are charts of Japan’s Nikkei 225 Index from 1992 and Hong Kong’s Hang Seng Index during 1997.
At five year intervals the stock market turned higher in August 1982, peaked ahead of the crash in August 1987 and then made a key bottom for Japanese equities in August of 1992. Five years after that the Hang Seng Index reached a pre-crash peak in August of 1997.
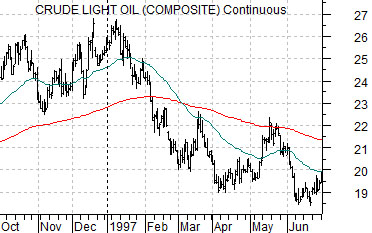
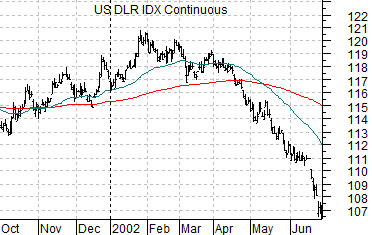
While the month of August has figured extensively in our comparisons we thought we would show another time cycle. Below is a chart of crude oil futures which shows the start of a declining trend in January of 1997 and then the U.S. Dollar Index from 2002.
The point here is that oil prices turned lower at the start of 1997 and five years later the CRB Index turned upwards in early 2002 as the U.S. dollar began to weaken.
So… we have shown 1982, 1987, 1992, and 1997. Let’s push things forward a bit more.
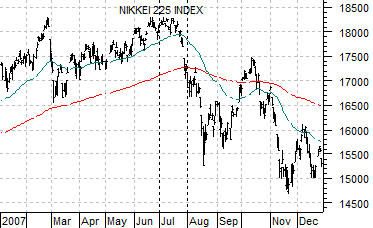
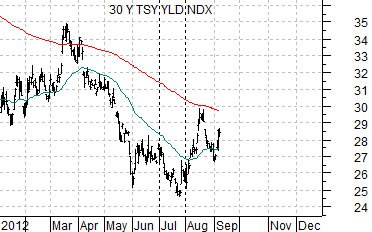
Last is a chart of the Nikkei 225 Index from 2007 and 30-year Treasury yields from 2012.
The Nikkei broke to the down side in July and August of 2007. This created the bearish cyclical trend that has dominated the markets for the last five years. Our argument that this is about the right ‘time and place’ for a cyclical pivot rests on the idea that the recent low for long-term Treasury yields marked the beginning of a trend shift back towards a stronger cyclical trend involving rising asset prices and yields.