With the U.S. markets closed for the Memorial Day holiday we will skip our usual Monday issue and move on to Tuesday.
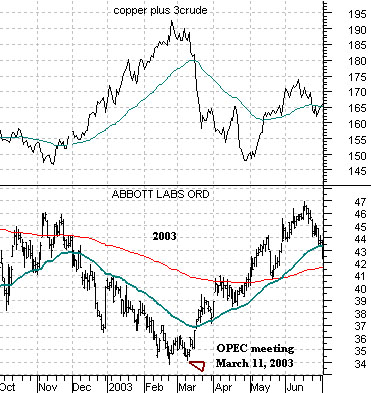
We have been focusing of late on the relationship between the share price of Abbott Labs (ABT) and cyclical asset prices. We showed, for example, that ABT declining steadily through the end of 1999 and into 2000 as the Nasdaq powered up to a final top. We have also argued that something similar occurred into March of 2003 so that will serve as the basis for today’s chart presentation.
Below we show the comparison between the sum of copper and crude oil futures (copper in cents added to three times crude oil in dollars) and Abbott Labs from October of 2002 through June of 2003.
The rise in copper and crude oil prices was offset by a steady decline in the share price of ABT until both trends reversed in March of 2003. Two events of note occurred in March of 2003. On March 11th OPEC voted to hold production quotas unchanged while on March 19th the second Iraq war began.
In hindsight the Iraq War was the more important of the two events but we still recall how crude oil prices pushed higher for months and then collapsed a day or two after OPEC decided to maintain production. From an intermarket point of view the break in the psychology that involved rising oil prices was confirmed by a return to strength by ABT.
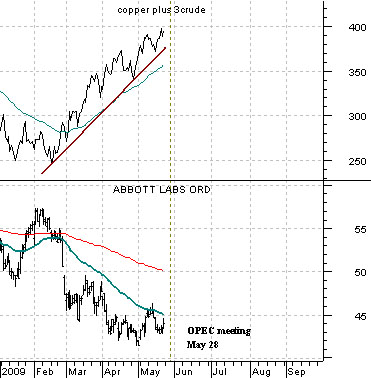
Below we show the same comparison for the current time period. The trend for copper and crude oil futures prices has clearly been higher since the first quarter of the year and, as usual, this trend has gone with an offsetting negative trend for ABT.
OPEC meets later this week and the general expectation is that production quotas will remain unchanged so barring some kind of surprise decision this will likely serve to be a non-event for the markets. Still… we find that we are still watching the action in ABT quite closely because our sense is that one of these days (or weeks) the markets will shift trends. Given our basic view that we will see cyclical strength into May followed by a correction through into August a resolution back up through the 50-day e.m.a. line by ABT concurrent with close to a 10% decline in copper and crude oil futures prices would actually fit the thesis quite nicely. While intriguing the point remains moot as long as ABT is trading below the 45- 46 level.
Equity/Bond Markets
In general economic expansion can continue almost indefinitely given very low energy prices. In other words we tend to have some sort of energy-related problem in front of recessions and stock market debacles.
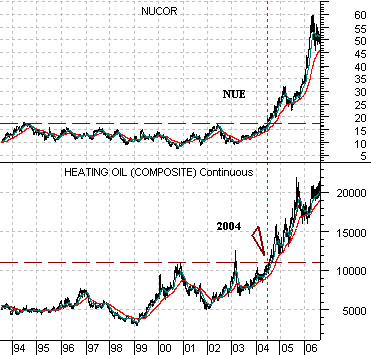
Below we show a comparison between steel maker Nucor (NUE) and heating oil futures. One of our arguments has been that it was the break to new all time highs by crude oil and heating oil in 2004 that helped create the financial mess that we are currently working through. In 2004 the strength in energy prices helped lift both commodity prices and the share prices of basic materials producers (i.e. Nucor).
Many believe that the markets and economic activity are now well on the road to recovery and that this must necessarily mean a return to relative strength by the commodity producers. That may prove to be true but we thought we would at least offer an alternative to what appears to be a widely accepted point of view.
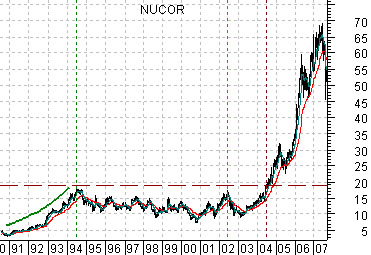
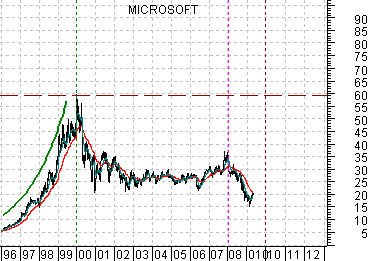
Below we compare the share price of Nucor from 1990 into 2007 with the share price of Microsoft (MSFT) from 1996 to the present day. The charts have been shifted by roughly 5 1/2 years so that the peak for Nucor in mid-1994 lines up with the cycle top for MSFT in early 2000.
The idea is that upwards explosion in the share prices of companies in the basic materials sectors in 2004 followed a decade of consolidation. NUE held below the 1994 highs for a full ten years until finally breaking out to the upside concurrent with energy prices in 2004.
What key cyclical sector has spent the last ten years consolidating? One answer would be… tech. In theory the next ‘stealth bull’ could actually be a return to strength by some of the major Nasdaq-related names that currently trade as low-growth value plays.
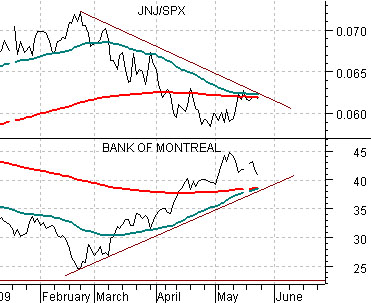
Quickly… we show below a comparison between the ratio of Johnson and Johnson (JNJ) to the S&P 500 Index (SPX) and the share price of Canada’s Bank of Montreal (BMO). When the moving average lines converge- as they have done on both of these charts albeit from different directions- it usually means that the markets have worked back to ‘neutral’ and have yet to embark on a new trend. Our challenge is to determine which theme is leaving the station on the way to a multi-year bull market, get positive, and then stay positive.