
July soybeans on Friday closed weaker and near the session low on profit-taking pressure. Bulls still have the solid near-term technical advantage. Prices are still in an 11-week-old uptrend on the daily bar chart. The next upside price objective for the bean bulls is to push and close prices above psychological resistance at $12.00 a bushel. The next downside price objective for the bears is pushing and closing prices below solid support at the April high of $10.64 1/2 a bushel. First resistance for July soybeans is seen at $11.77 1/2 and then at last week’s high of $11.89 1/2. First support is seen at Friday’s low of $11.64 and then at $11.50.
$16.50 ——– the contract high
$11.45 3/4 — 10-day moving average
$11.07 1/4 — 20-day moving average
$10.53 1/2 — 40-day moving average
$6.85 ——– the contract low
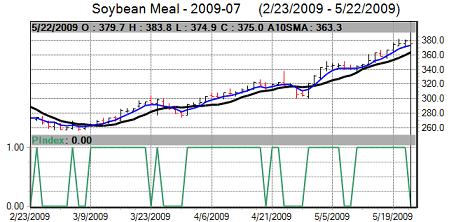
JULY SOYBEAN MEAL
July soybean meal on Friday closed weaker and near the session low on profit taking after hitting a fresh 8.5-month high early on. Bulls still have the solid near-term technical advantage. The next upside price objective for the bulls is to produce a close above solid technical resistance at $390.00. The next downside price objective for the bears is pushing and closing prices below solid technical support at $350.00. First resistance comes in at $380.00 and then at Friday’s high of $383.80. First support is seen at Friday’s low of $374.90 and then at $370.30.
$435.50 — contract high
$363.30 — 10-day moving average
$347.70 — 20-day moving average
$326.90 — 40-day moving average
$203.30 — the contract low
Source: VantagePoint Intermarket Analysis Software
Call now and you will be provided with FREE recent forecasts
that are up to 80% accurate. 800-732-5407
If you would rather have the recent forecasts sent to you, please go here.
JULY SOYBEAN OIL
July soybean oil on Friday closed slightly higher and nearer the session low. Bulls still have the slight near-term technical advantage, but are fading and need to show fresh power soon. The next upside price objective for the bean oil bulls is pushing and closing prices above solid technical resistance at last week’s high of 40.20 cents. Bean oil bears’ next downside technical price objective is pushing and closing prices below solid technical support at 36.00 cents. First resistance is seen at Friday’s high of 38.49 cents and then at last week’s high of 38.96 cents. First support is seen at Friday’s low of 37.90 cents and then at 37.64 cents.
71.90 — the contract high
38.59 — 10-day moving average
38.03 — 20-day moving average
36.81 — 40-day moving average
29.23 — the contract low
JULY CORN
July corn on Friday closed higher, nearer the session high, at a bullish weekly high close and closed at the highest closing level in 4.5-months. Bulls have the near-term technical advantage in corn. Prices are still in a four-week-old uptrend on the daily bar chart. The bulls’ next upside price objective is to push and close prices above solid technical resistance at the January high of $4.49 1/4 a bushel. The next downside price objective for the bears is to push and close prices below solid technical support at $4.00 a bushel. First resistance for July corn is seen at last week’s high of $4.34 3/4 and then at $4.40. First support is seen at Friday’s low of $4.23 1/2 and then at $4.20.
$8.26 ——– the contract high
$4.24 3/4 — 10-day moving average
$4.14 1/4 — 20-day moving average
$4.06 1/4 — 40-day moving average
$3.15 3/4 — the contract low
JULY CBOT WHEAT
July Chicago wheat on Friday closed solidly higher, nearer the session high, closed at a bullish weekly high close and hit a fresh 16-week high. Bulls have the near-term technical advantage and gained fresh upside momentum on Friday. The next downside price objective for the bears is pushing and closing prices below solid technical support at last week’s low of $5.63 1/4. Bulls’ next upside price objective is to push and close July futures prices above solid technical resistance at $6.34 1/4 a bushel. First resistance is seen at Friday’s high of $6.18 and then at $6.25. First support lies at $6.00 and then at Friday’s low of $5.93.
$11.44 3/4 — the contract high
$5.92 3/4 — 10-day moving average
$5.71 1/2 — 20-day moving average
$5.55 1/4 — 40-day moving average
$4.48 ——– the contract low
JULY KCBT WHEAT
July KCBT wheat on Friday gapped higher on the daily bar chart, hit a fresh 4.5-month high and closed at a bullish weekly high close. Bulls have the near-term technical advantage and gained fresh upside momentum on Friday. Prices are in a five-week-old uptrend on the daily bar chart. The bulls’ next upside price objective is pushing prices above solid technical resistance at the January high of $6.92. The bears’ next downside objective is pushing and closing prices below solid technical support at $6.10. First resistance is seen at Friday’s high of $6.67 and then at $6.75. First support is seen at Friday’s low of $6.55 and then at $6.53.
$11.35 ——– the contract high
$6.42 3/4 — 10-day moving average
$6.20 1/4 —- 20-day moving average
$6.02 ——– 40-day moving average
$4.60 ——– the contract low

