The appeal of televised poker has much to do with the season-cancelling National Hockey League lockout through the 2004- 05 season. Sports networks needed to fill empty schedules which led to an increase in Texas Hold’em air time.
While we do not play poker our understanding is that at a certain level you stop playing your own hole cards and start playing your opponents. It isn’t what you have that is important but rather what you believe your opponent has or even what you think he thinks you have. In other words high-level poker becomes similar to the sort of second derivative trading that one tends to see in the financial markets when the rate of change of the rate of change starts to determine trends.
Our point? If we have one- and there is always the chance that we don’t- it is that this week’s ‘news’ reminds us of a poker game. The Fed is going to announce a major monetary stimulus initiative that in most cases should be bullish. Yet if everyone expects the news to be positive then chances are it will engender a bearish response which convinces many to fade the news in the expectation of a sharp decline. With nerves tested in all directions the only reasonable responses may be to muck your cards (i.e. fold) or go all in.
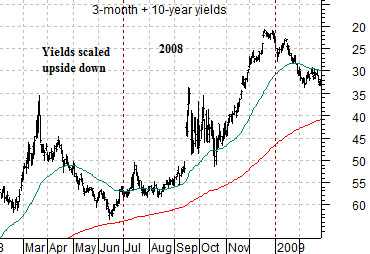
Below we return to one of the core arguments that we have been using since the second quarter of this year. The chart shows an upside down perspective of the sum of 3-month and 10-year Treasury yields from two years ago. The idea is that the cyclical trend lags bond PRICES by two years so the upside trend for yields during the second half of 2008 should serve as an approximation of the cyclical trend for asset prices through the second half of this year.
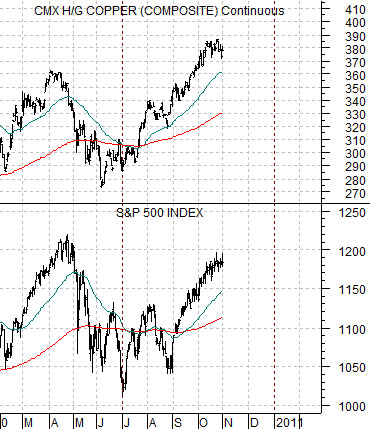
Next we show a chart of copper futures and the S&P 500 Index. We are showing the cyclical trend in two ways through economically sensitive copper prices and the broad U.S. equity market.
Returning to our poker analogy our inclination is to go ‘all in’ here. Why? Because our work suggests that the markets are going to continue to find ways to resolve asset prices upwards at least through the end of this quarter. We would not be surprised to see the markets dump off- perhaps sharply- following the Fed’s announcement but we would be even more surprised if the rising trend were altered as a result.
Equity/Bond Markets
Here is our bias: the ‘bear market’ may have begun back in 2004 or even late 2005 but in many ways it gained in intensity in mid-2007. The downward trend was felt specifically in the banking sector with rising bond prices, Japanese yen, and gold prices serving as an offset. Our bias is that we expect the bond market, gold, and yen to decline and when this happens it will mark the start of a broader recovery in the laggard banks. The reality is that the bond market, gold, and yen are still trending upwards so we are- as usual- on the wrong side of an ongoing trend in search of some way to determine a trend change point.
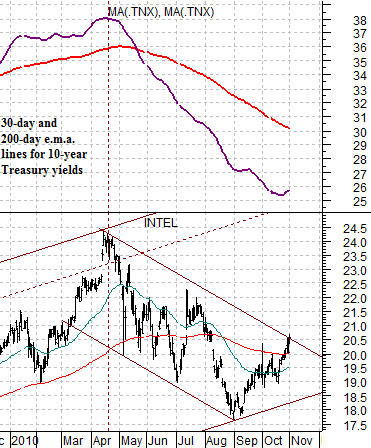
Below is a chart comparison between Intel (INTC) and two moving average lines (30-day e.m.a. and 200-day e.m.a.) for 10-year Treasury yields.
The argument has been that Intel trends with the moving average lines for yields. This marked the top for INTC back in April. Within the confines of the trading channel drawn on the INTC chart the stock would have to rise through the channel top in order to swing the trend for yields higher. Yesterday’s price action was very close to ‘enough’.
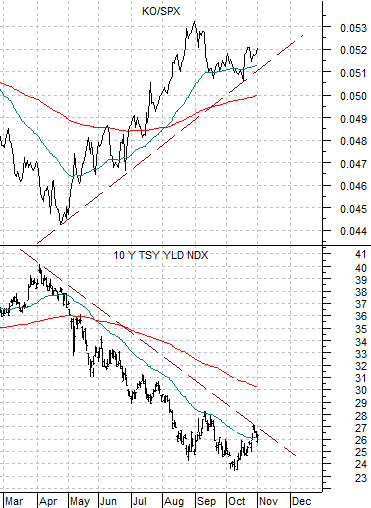
On the other hand… further below we show the ratio between Coca Cola (KO) and the S&P 500 Index (SPX) and 10-year yields. The chart argues that as long as Coke is outperforming the broad U.S. market the trend for yields is somewhat lower. The Intel chart argues for higher yields while this chart suggests that the issue has yet to be determined.
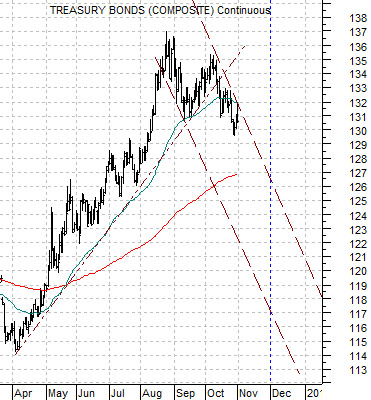
Our view is that there is still the potential for a serious decline in bond prices through November. We showed some time back based on a few strange comparisons (Panasonic and the ratio between Johnson and Johnson and the TBond futures) that we could see a bond price low at the end of this month.
The last chart below shows the U.S. 30-year T-Bond futures along with a trading channel that suggests that it is possible for the TBonds to decline back to something close to 117- 118 by month end.