We could probably chew up the entire issue today with a discussion about inflation and deflation but we have other fish to fry so we will make this as simple as possible. Prior to 1990 the markets’ major concern was inflation so a declining trend in long-term interest rates reflected by a rising trend for long-term bond prices was viewed as a positive by the equity markets.
Post-1990 in Japan and roughly post-1998 in the U.S. the trends shifted away from inflationary concerns and over to worries about declining asset prices. A couple of decades ago a rising bond market was bullish for stocks but in recent years bullish equity markets periods have occurred during those periods of time when bond prices were falling.
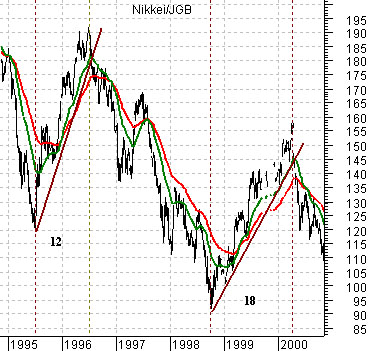
Belowwe show a chart of the ratio between Japanese equities (Nikkei 225 Index) and 10-year Japanese bond (JGB) futures from late 1994 into 2000.
One of the features of the post-1990 time period in Japan has been intense but reasonably short equity markets rallies marked by falling bond prices. In other words a positive or bullish trend will take place when the ratio between equities and bonds is on the rise. The trend ran roughly 12 months from 1995 into 1996 and for 18 months from 1998 into 2000.
Below we show the Nikkei/JGB ratio from the end of 2007 to the present day. The chart makes the case that the rally from March into June this year is really little different than the rally that carried prices higher into mid-June last year. For the second year in a row the markets have staged a recovery rally through the seasonally strong time frame that extends from March into June.
The point that we are circling is that three months into the recovery it is still almost impossible to tell whether this is a short-term bounce similar to last year or the start of a sustained push that will run for a year or more. What we are attempting to do today is show the two alternate outcomes. If this is a bear market rally then the equity/bond ratio should resolve to the downside into at least August if not October and if this is a new bull market than one would have to expect a rather prolonged period of ‘more of the same’ through into 2010.
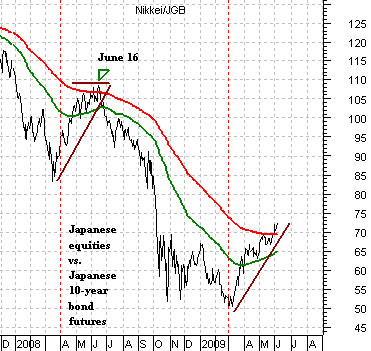
On page 1 we tucked in the observation that a solid 12- 18 month asset price rally would likely include ‘more of the same’. By this we meant that the dominant themes that have emerged through the first 3 months of the rally would most likely continue until the cycle had run it course.
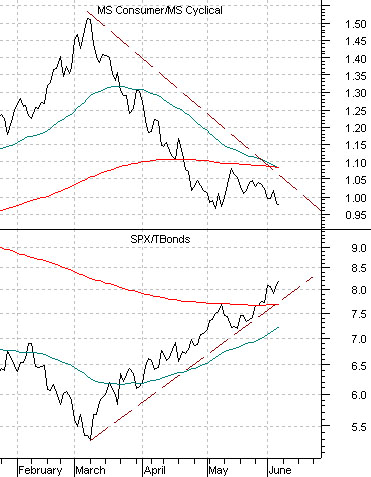
Belowwe shift from Japan over to the U.S. through the chart of the ratio between Consumer and Cyclical stocks and the ratio between the S&P 500 Index (SPX) and the U.S. 30-year T-Bond futures.
The premise is that a positive trend will include a rising equity/bond ratio. The chart makes the argument that a rising ratio will go with a declining ratio between consumer and cyclical stock prices. In other words as long as the markets are favoring the cyclical sectors and pressuring the bond market lower the trend that began back in March will continue.
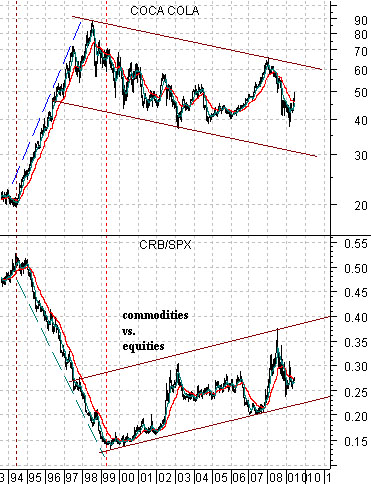
The chartbelow compares the share price of Coca Cola (KO) with the ratio between commodity prices (CRB Index) and equity prices (S&P 500 Index).
Over the past number of years there has been increasing interest in commodities as a investment class. We will argue that this makes sense in a world that does not include a rising trend for major consumer and pharma stock prices.
The chart shows that over the past ten or so years the stock price of KO has been in a down trending channel. In 1998 the stock traded close to 50 times earnings and 2.7 times the market’s PE ratio while in 2009 it is closer to 17 times earnings and very close to 1 times the market’s PE.
The point is that valuations for the major consumer growth stocks reached Japan-like levels at the end of the last decade and the markets have been working through the process of bringing values back into line through growing earnings and dividends along with periodic bouts of falling interest rates.
In the absence of rising prices for everything from Microsoft to Coca Cola and Merck to Wal Mart ‘money’ has tended to migrate into those sectors that offer the potential for capital appreciation. The focus since the Nasdaq’s peak in 2000 has been on asset prices with everything from real estate to energy to grains prices taking a turn.
The commodity bulls argue that raw materials prices have entered into some kind of multi-decade super cycle and that we will see 200+ oil prices and gold north of 2000 before the process is concluded. Our view is either substantially more simple or infinitely more complicated- depending on one’s perspective- because we tend to believe that the commodity price rally will run right up to the point where something else takes its place.
By ‘something else’ we are referring to the broad theme represented by the share price of Coca Cola. If Coke’s earnings and dividends roughly double every 10 years (an assumption made by extrapolating past results) then it isn’t too large of a leap to suggest that some time within the next decade or so the stock will break out of the downward sloping channel and go on to make new highs. When this happens we would expect to see the commodity/equity ratio turn lower similar, perhaps, to 1994- 1995 marking the end of the run for commodities as an investment class.