We tend to believe that there is a seasonal trend within the markets that tends to create the perception of growth into the May/June time frame and weakness into October/November. This is one of the reasons why ‘sell in May and go away’ often works while also helping to explain why so many bear market lows are made into October.
Given, however, that May is well behind us and we are still more than a month away from October our initial focus today is on two time periods involving the month of August that led to significant changes in the trend. We show one of them on this page and the other on page 5.
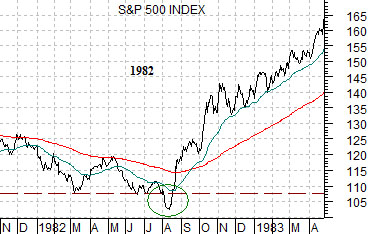
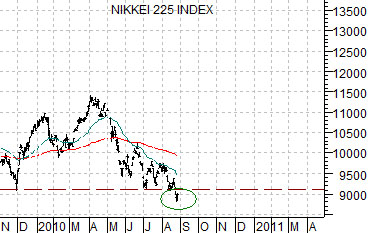
Below is a chart of the S&P 500 Index (SPX) from 1981 into 1983 while below it we have lined up a chart of Japan’s Nikkei 225 Index from late 2009 to the present day.
In general August tends to be a transition month between the cyclically strong spring and the depressingly slow autumn. In 1982, however, the month of August marked the bear market lows for the equity markets following a key break of support. Once the SPX closed below the 103 level the index pivoted right back to the upside and into a new bull market.
Our thought was that the Nikkei had just broken down through key support after closing under the 9200 level this month. While the comparison between 2010 and 1982 is somewhat tenuous the argument was that market bottoms usually occur when least expected. If this index managed to move sharply back above 9200 and then on through the 200-day e.m.a. line at 10,000 then a case could be made for yet another August trend change.
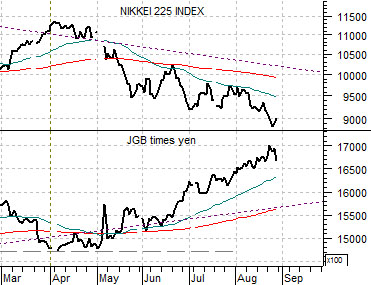
The chart at bottom compares the Nikkei 225 Index with the product of the Japanese 10-year (JGB) bond futures and the Japanese yen futures.
Our premise is that the Nikkei has been under pressure as the bond market and the yen have trended higher. If the Nikkei is going to manage to swing higher both the yen and the Japanese bond market will have to start to decline. This is exactly what happened at the end of last week so while one day does not confirm a trend change at least we have the sense that if, as, or when the yen and JGBs start to weaken the offset will be a fairly robust rebound in the Japanese stock market.
Equity/Bond Markets
We started off today with an argument regarding the Japanese stock market. The idea is that the Nikkei represents one of the weaker components of the cyclical trend so it will tend to lag the recovery rather than show up as an early leader.
The point is that to make a case with regard to a stronger Nikkei we have to be able to show that early leadership may have already begun to form.
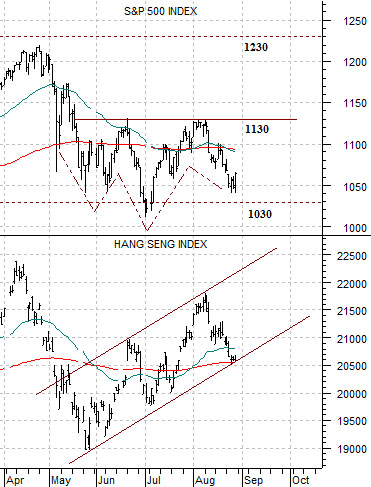
Below is a comparison between the S&P 500 Index and Hong Kong’s Hang Seng Index.
IF the Hang Seng Index is trending higher up the trading channel THEN the argument would be that the next time it tests the top of the range the SPX should be back up to resistance around 1130. If the SPX manages to push through 1130 then the chart supports the argument that the rally could continue until 1230 it tested.
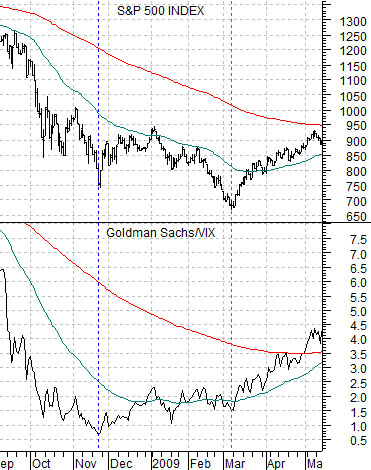
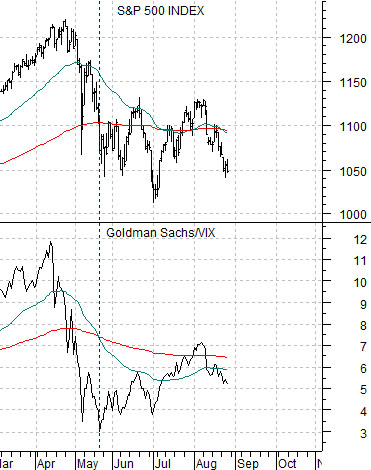
Below is a chart comparison between the S&P 500 Index and the ratio between Goldman Sachs (GS) and the CBOE Volatility Index (VIX) from 2008- 2009. We have included the same comparison for the current time frame below right.
The S&P 500 Index bottomed in March of 2009 some months after the Asian trend began to strengthen in late 2008. The GS/VIX ratio tracked with the Asian trend and made three small bottoms at higher levels between November of 2008 and March of 2009. The current situation is somewhat similar as the Hang Seng Index made a low in May concurrent with the GS/VIX ratio. While this could easily drag on into September the idea is that if the Hang Seng Index turned upwards last May the SPX should start trend higher in due course.