We mention from time to time that getting the bond market ‘right’ is one of the keys for our work. To the extent that the bond market tends to lead the cyclical trend knowing whether long-term yields are moving higher or lower is quite important.
The problem with determining the trend for yields is that you get a different answer depending on which time frame is used. 10-year yields have risen from close to 2.3% last October to a peak around 3.7% this month so from this perspective the trend appears to be upwards. Yet if we consider the last twelve months we notice that yields topped out around 4.0% at the end of the first quarter in 2010 so a case can be made that until yields rise back to or above 4.0% the trend may well be downwards.
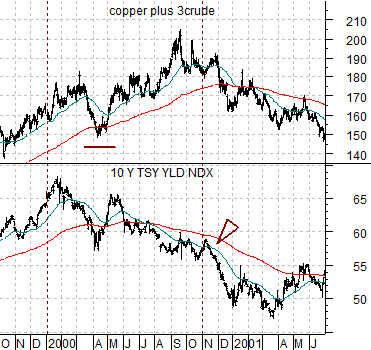
Below is a chart of 10-year Treasury yields and the sum of copper (in cents) and crude oil (in dollars times 3) from late 1999 into mid-2001.
Long-term yields peaked in January of 2000. The start of the downwards trend for yields in 2000 occurred ahead of the stock market’s peak and well before the top for copper and crude oil prices. We have argued that the cyclical slow down that ran through 2001 and 2002 was forecast or anticipated by the turn lower for bond yields at the start of 2000.
The point is that when yields turn lower we expect to see the cyclical trend pushing higher for the next 9 to 12 months at which time it will swing downwards to catch up with falling long-term interest rates.
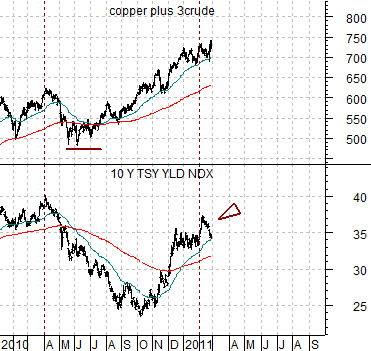
Next is the same chart comparison for the current time period.
Our view has been that yields will resolve higher into the autumn of 2012. Our concern is that over the last 10 months yields are still technically in a down trend which means that a comparison to 2000 is somewhat valid.
Notice that 10-year yields declined through much of this month in a manner similar to November of 2000 while in both cases copper and crude oil prices remained stronger. If yields continue to decline through March with enough weakness in copper and crude oil to break down through the rising 200-day e.m.a. line then- at least in theory- a case could be made that the cyclical recovery is in serious jeopardy.
Equity/Bond Markets
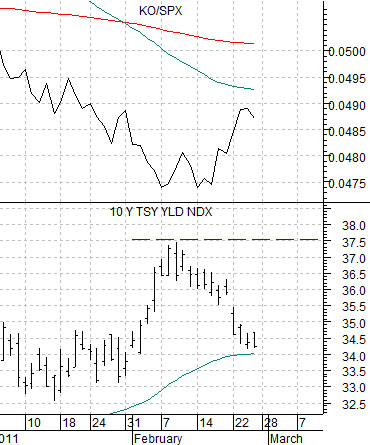
Below is a chart of the yield index for 10-year U.S. Treasuries and the ratio between Coca Cola (KO) and the S&P 500 Index (SPX).
The quick point here is that a declining trend for yields tends to go with cyclical weakness which, in turn, improves the relative price performance of consumer growth stocks like Coke. Our view is that the decline for yields in February was a mere correction in a rising trend and that as yields resolve upwards the KO/SPX ratio will move lower.
We have argued that if all goes well 10-year yields will push up to 4.5% this year. If we see signs of serious weakness in copper futures prices and even more strength in the KO/SPX ratio during March we may have to reevaluate our views.
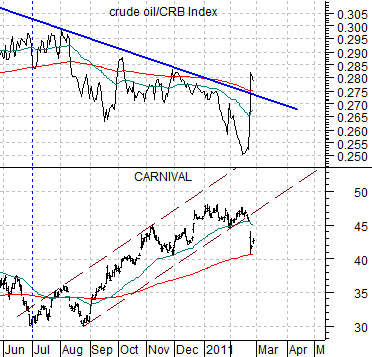
Below is a chart of Carnival (CCL) and the ratio between crude oil and the CRB Index. At the end of last week energy prices began to cool somewhat on a relative basis which removed some of the pressure on energy ‘user’ stocks like Carnival.
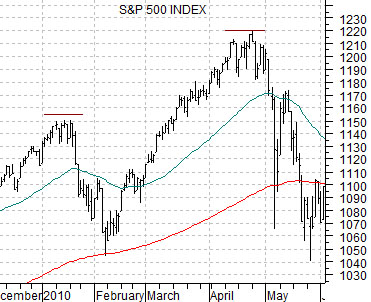
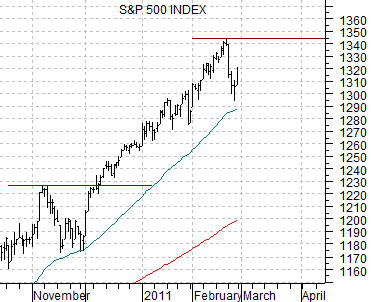
Next are two charts of the S&P 500 Index. The top chart is from late 2009 into May of 2010 while the lower chart starts in October of 2010.
Bottoms tends to be made on sharp intraday reversals while tops tend to be made after the market tests the highs a few times. Notice that in January and April of 2010 the SPX made repeated rallies back to the highs before turning lower into February and May. In November of last year the decline came almost ‘out of the blue’ after the SPX reached new highs early that month. Our point is that even if this proves to be a ‘top’ for the equity market we would expect to see at least one good rally back towards 1340 before meaningful weakness kicks in.