In the months to come economists will spend quite a bit of time trying to figure out when the Fed will start to tighten credit through increases in the Fed funds rate. Our view is that short-term interest rates will start to rise far sooner than most expect but, on the other hand, it is not the first rate hike that one should be concerned about. In general the two times that warrant concern are, (1) the last rate hike, and (2) the first rate decrease.
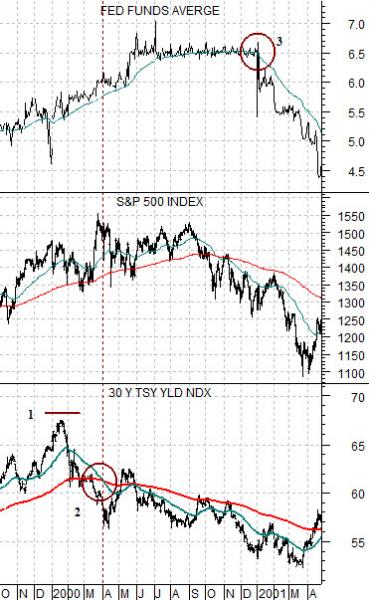
Just below is a chart of the Fed funds target rate, the S&P 500 Index, and 30-year Treasury yields from the autumn of 1999 into the spring of 2001.
The argument is that long-term yields tend to ‘lead’ short-term yields. In other words the Fed won’t start to raise the funds rate until well after long-term yields turn higher and will tend to cut the funds rate a year or so after long-term yields begin to decline.
The chart shows that 30-year Treasury yields reached a peak in January of 2000- well in advance of the actual peak for the S&P 500 Index.
Notice on the chart that the moving average lines for 30-year yields ‘crossed’ to the down side around the end of March in 2000. Notice as well that this coincided quite nicely with the cycle peak for the SPX (and Nasdaq). In the months or years to come we will use this relationship as we attempt to remain equity markets positive through the cycle until 30-year yields not only start to decline but fall far enough and long enough below the 200-day e.m.a. line so that the 50-day ‘crosses’ to the down side.
The chart also shows that the Fed funds rate did not reach its cycle peak until May of 2000 when the FOMC raised it to 6.5%. The final hike of the funds rate took place after long-term yields began to decline and a few months after the stock market had reached its top.
The final detail has to do with the point in time when the Fed reversed its’ policy course and started to cut interest rates. After raising the funds rate in May of 2000 it started to lower yields in January of 2001.
We tend to believe that, in sequence, the bond market leads the stock market which, in turn, leads the Fed. We tend to believe that each time short or long-term yields reverse direction there is a theme change within the equity markets. We also tend to believe that, all things considered, the Fed’s trend-following tendencies do more damage than good.
Equity/Bond Markets
We are always worried about something. We are constantly concerned about any number of details within the markets as prices chop back and forth on a daily basis. We have seen too many crashes, corrections, consolidations, and unforeseen surges to ever feel complacent. We suspect that this will never change.
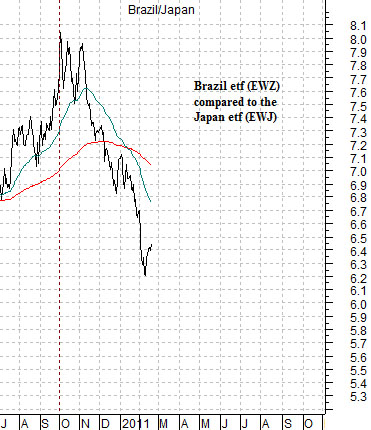
If we were asked what we are concerned about at present we would likely distill it down to three basic points. First, we have yet to see enough flattening in the yield curve. Second, for all intents and purposes the trend for long-term yields is still lower because current yields remain below the peak set last year. Third, the trend shift within the equity markets that began last autumn when long-term yields started to rise included strength in the developed markets (U.S. and Japan) compared to higher-growth sectors like Hong Kong and Brazil.
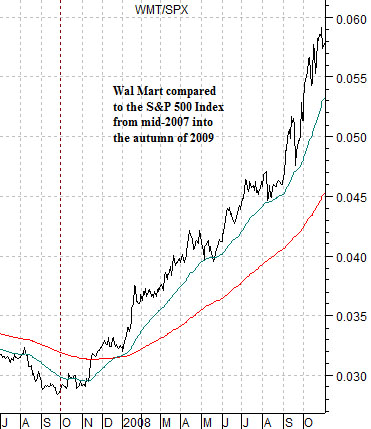
Below is a chart from 2007- 2008 which depicts the ratio between Wal Mart (WMT) and the S&P 500 Index (SPX). The argument is and has been that shift towards a stronger WMT/SPX ratio foreshadowed the peak and collapse of commodity prices nine months later in mid-2008.
A rising WMT/SPX ratio suggests that money is starting to move away from risk. If money is moving away from risk even as risk-based markets (i.e. commodities) are surging higher… chances are that something bad is going to happen. Which, of course, it did.
Below we show the Brazil/Japan ratio from the current time period. Notice that Brazil began to weaken against Japan around the end of the third quarter last year. Is relative strength in Japan similar to relative strength for WMT in 2007? Or, perhaps, does it merely represent a shift in the direction of risk-based capital flows instead of a move away from risk? Our view is that the answer lies with the bond market. In 2007 (chart below) 10-year yields were declining as the WMT/SPX turned upwards while in 2010- 11 long-term yields are rising. While we may be concerned our take on the issue is that it is an indication of a broadening of cyclical strength instead of a harbinger of problems to come.