In retrospect all markets trends make sense. The left side of the chart, after all, is much easier to read than the right side. In our daily work we attempt to find a succession of clues to help up build a thesis which we then proceed to stress test from as many different angles as possible. Some times… we are even right. Not as often as we would like, of course, but this is a challenging vocation.
Our opening comments are a preamble to something that we were pondering over the past few days. We are going to mix apples with oranges and then throw in a few lug nuts and cuff links for good measure.
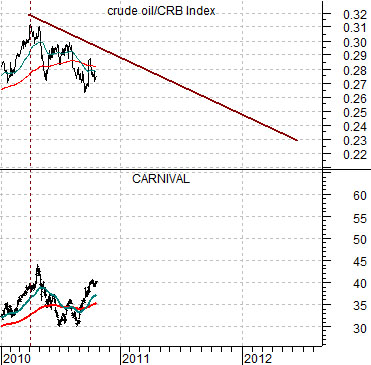
The topic has to do in a general sense with the share price of Carnival Cruise Lines (CCL). Not CCL in specific but the theme that it represents. We have argued over the years that CCL is an energy-using cyclical and that it tends to do well when crude oil prices are weak relative to broad raw materials prices.
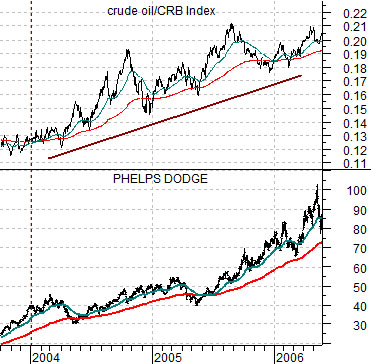
Below is a chart of the ratio between crude oil futures and the CRB Index along with the share price of former copper mining giant Phelps Dodge. PD has since been taken over by FreePort McMoRan but in years past we used PD for much of our work when we focused on the commodity cyclical sector.
The chart runs from late 2003 into mid-2006. The focus is on what happened to PD a year or so after the low point for the 2000- 2002 bear market and how it related to the trend for energy prices.
Below we compare the ratio between crude oil and the CRB Index with the share price of CCL starting at the beginning of 2010.
Some time after the stock market bottomed in late 2002 the crude oil/CRB Index ratio began to rise arguing for a strong energy and/or commodity theme for the equity markets. Our thought has been that the current cycle appears somewhat different than 2004 in that the crude oil/CRB Index ratio may actually be starting to weaken somewhat. We have spent some time showing this particular detail in the context of the current position of the Aussie dollar/euro cross rate.
The point is that while commodity ‘producers’ dominated the last markets cycle a case can be made that the current situation could be leaning more towards the commodity ‘users’. If this proves to be the case then perhaps CCL will follow a similar path to that of PD during 2005 and 2006.
Equity/Bond Markets
The real news is likely to come next week following the Fed’s QE2 decision and the monthly U.S. employment data. However, we continue to fixate somewhat over the current trend of the Japanese bond market.
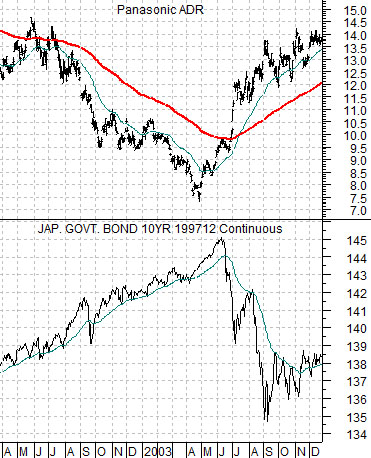
Below is a chart comparison between Panasonic (PC) and the Japanese 10-year (JGB) bond futures from 2002 through 2003.
The ongoing argument has been that when PC swings up through its 200-day e.m.a. line- as it did in mid-2003- the trend for Japanese bond prices should turn lower.
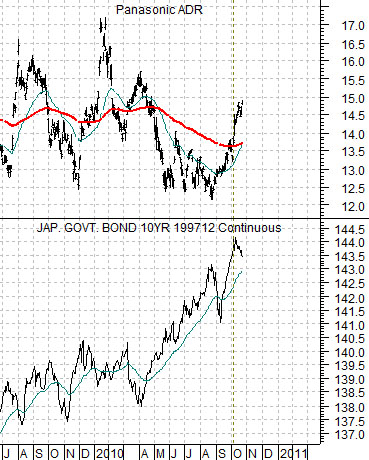
The current situation is shown below right. Notice that PC has made repeated (and unsuccessful) attempts to swing above the moving average line since the second half of 2009. With the stock price rallying recently and minor weakness showing up in the Japanese bond market our view is the bond market’s rising price trend may have come to an end around the start of the fourth quarter this year. Time will tell.
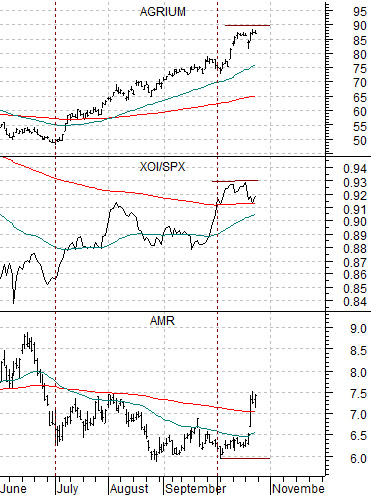
Another theme shift that we have been following has to do with the airline sector. This is, of course, an extension of the energy ‘user’ cyclicals that is based on the crude oil/CRB Index ratio.
At the start of the third quarter this year the markets shifted over to a stronger commodity price trend. This showed up in a rally for Agrium (AGU) as grains prices moved higher along with strength in the oils (XOI) compared to the broad market (SPX). This month the markets have started to push money towards the airlines as the XOI/SPX ratio has begun to weaken somewhat. We show the comparison below.