We are going to change gears somewhat and start with a fairly serious ‘macro’ perspective today.
On occasion we have shown comparisons that argue that the share price of Coca Cola (KO) tends to trend higher when commodity prices are flat to lower. In other words over time a strong and rising price trend for consumer companies like Coke tends to reflect some kind of offsetting weakness for raw materials prices.
So… how does this view fit with the observation that both seem to be rising at the same time these days?
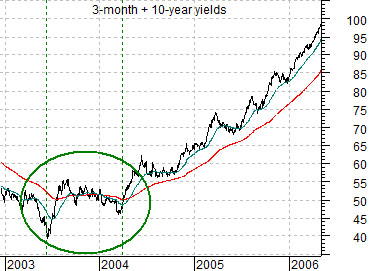
By way of explanation we have included a chart of the sum of 3-month and 10-year Treasury yields at top right. This charts is from the end of 2002 into the spring of 2006.
The 2-year lag argues that the low point for yields will precede the high point for cyclical growth by close to two years. In this instance the bottom for yields was reached between mid-2003 and the spring of 2004 suggesting some kind of cyclical price peak in early 2006.
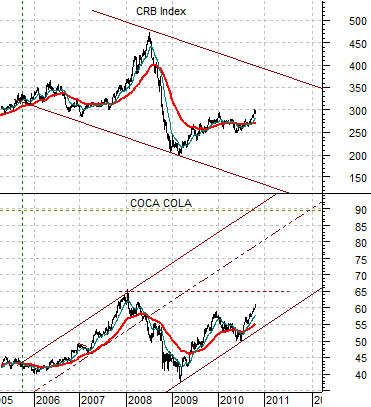
Just below we show the CRB Index and the share price of Coke from 2005 to the current time period.
We can create all kinds of visual impressions by adding channel lines to a chart. In this instance our intent is to try to make the case that Coke’s share price gains are actually a reflection of a negative trend for the CRB Index that began way back in late 1995. The twist- and one that we struggled with mightily from late 2007 into mid-2008- was that the CRB Index is declining within a very wide channel. The initial down trend began in 2005 with a second bottom in early 2009 while the ‘width’ of the channel was created by the parabolic rise into 2008.
If our argument proves to be correct then it helps to explain why commodity and equity prices have been moving upwards in tandem since the first quarter of 2009. Both were effectively ‘channel bottom’ at that time with no where else to go but up.
There is still sufficient space within the CRB Index’s channel to allow for further gains but the first real test of this thesis should come if, as, or when Coke manages to push through the highs (around 65) set at the start of 2008.
Equity/Bond Markets
We mentioned in yesterday’s issue that there are two commodity-based ratios that we are currently fixating over. The first is the ratio of crude oil to the CRB Index while the second relates to the gold/CRB Index ratio. We will cover the latter on today’s third page.
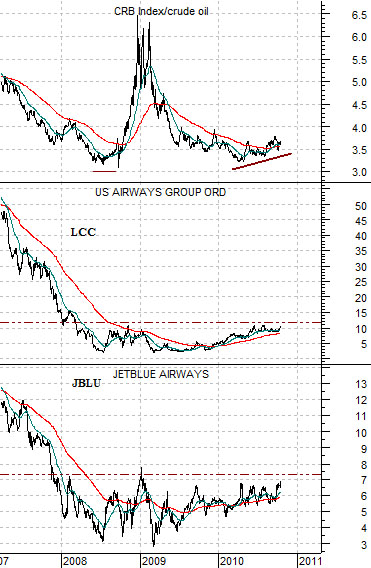
Below is a chart comparison between two airline stocks (JetBlue- JBLU) and US Airways (LCC) and the ratio between the CRB Index and crude oil futures.
The CRB Index/crude oil ratio rises when crude oil is ‘weak’ and declines when crude oil is ‘strong’.
The argument is that this ratio defines the overall trend for the airline stocks. A period of relative weakness by crude oil to the CRB Index would go with a period of price strength for the airlines. We noticed, for example, that AMR (the stock that we usually use for these types of arguments) was up more than 12% yesterday so this is a fairly timely issue.
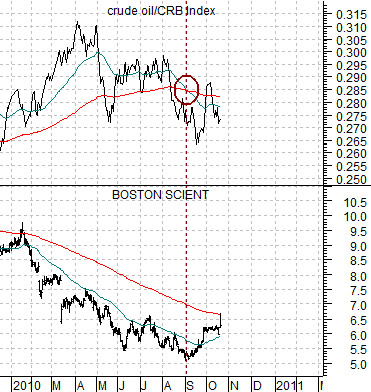
Another stock or theme that we follow that appears (in some way) related to the relative strength of crude oil is medical products maker Boston Scientific (BSX).
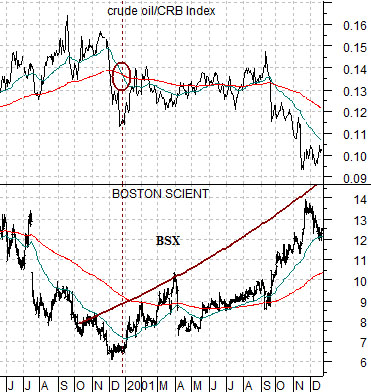
At bottom is a comparison from 2000 through 2001. The idea is that the cycle lows for BSX were reached at the end of 2000 when the crude oil/CRB Index ratio began to weaken. In fact the bottom for BSX was reached right about the time that the 50-day e.m.a. crossed down through the 200-day for the crude oil/CRB Index ratio.
Fast forward almost ten years and we find BSX back at what may be a cycle low with the crude oil/CRB Index trending lower. As the moving average lines crossed in early September the share price of BSX was at some kind of bottom. In reaction to the previous quarter’s earnings the share price was nicely stronger yesterday with an intraday test of the 200-day e.m.a. line close (around 6.70).