If we had it to do all over again we would probably have reversed the order of our last two issues. On Friday of last week we focused on the lag between the cyclical trend and the yield spread to make the point that current weakness should fade as we work through the balance of the quarter. On Monday, however, we argued that current conditions appeared somewhat similar to the second half of 2008.
The two arguments would have played somewhat better the other way around. We should have made the case that we were currently mired in a slow down similar enough to the second half of 2008 to create concern for investors and then showed how the lagged impact of the yield spread was set to save the day.
In any event… there are a few sharp similarities to 2008 and a few notable differences. Let’s start with the similarities.
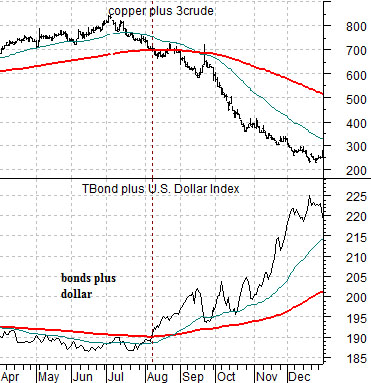
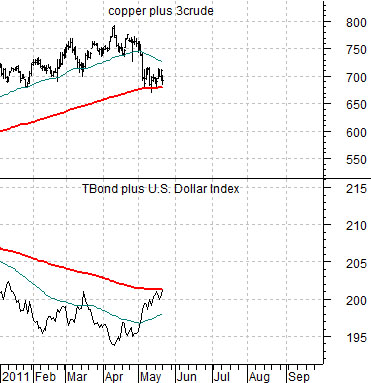
Below is a chart of the sum of copper (in cents) and crude oil futures (in dollars times 3) and the sum of the U.S. 30-year T-Bond futures and the U.S. Dollar Index futures from 2008. Below right we have included the same chart comparison from the current time frame.
The cyclical trend reached a peak at the end of the second quarter of 2008. Through the month of July the sum of copper and crude oil futures declined to the 200-day e.m.a. line while the combination of the TBonds and dollar bounced along beneath the moving average line.
In August of 2008 the sum of the TBonds and dollar broke up through the moving average line while the sum of copper and crude oil broke below the moving average line. From there both combinations of markets drove hard until extremes were reached in December. Once the dollar and bond market stopped rising the pressure on copper and crude oil abated leading into a recovery for cyclical asset prices.
The next chart shows that the cyclical trend peaked around thee start of the current quarter with both sides of the trend moving back to their respective moving average lines. In a sense the action is strangely reminiscent of July and August of 2008. What is different- so far- is that neither side has actually moved briskly through the moving average line. From a glass is half full perspective this could still be nothing more than a minor correction in an ongoing trend.
Equity/Bond Markets
One similarity to 2008 is the way the dollar and bond market are starting to rise even as copper and crude oil prices begin to decline. Since the second half of 2008 was hardly a profitable time to be long much of anything besides long-term high-quality bonds we thought we would show one of the potential differences.
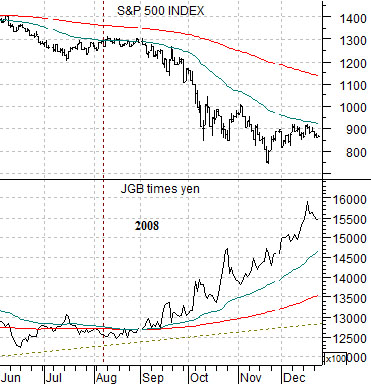
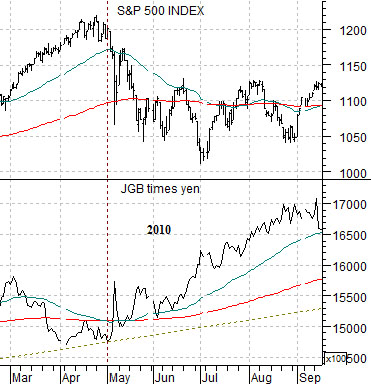
Just below is a chart of the S&P 500 Index and the combination of the Japanese 10-year (JGB) bond futures times the Japanese yen futures from 2008. Below right is the same comparison from 2010.
Above we showed that in early August of 2008 the sum of copper and crude oil broke below the 200-day e.m.a. line as the sum of the TBonds and DXY broke above the moving average line. If we replace the TBond and dollar with the Japanese bond futures and yen we have a fairly similar picture.
The collapse of cyclical asset prices in 2008 went with a steady rise in the Japanese bond market and yen.
The same basic relationship took place in 2010. The chart below right shows how the stock market decline from May through August last year went with similar strength in the JGBs and yen. The point is that if the current situation is a mere replay of the larger decline in 2008 and the smaller break in 2010 then the Japanese bond market and yen should be on the rise.
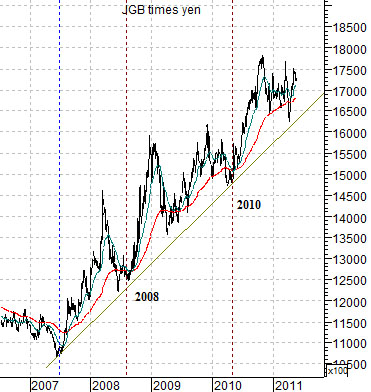
Below is a chart of the JGB times the yen from 2006 to the present day. We are attempting to point out that the three most bearish points for the cyclical trend (mid-2007 was the start of downward pressure for the banks, mid-2008 marked the melt down for commodities, and 2010 was last year’s Eurozone crisis) all occurred with the JGBs times yen at a bottom and that as conditions worsened the JGBs and yen moved higher. To date… that has really not happened. In the very short term the Japanese yen has actually declined somewhat against the dollar while rising a bit against the euro and the Australian dollar futures.