It is probably unfair to pin all of the hopes of continued equity markets strength on copper prices but… to the extent that copper has led the charge so far… it isn’t too much of a stretch to suggest that weaker copper prices will soon become something of a problem.
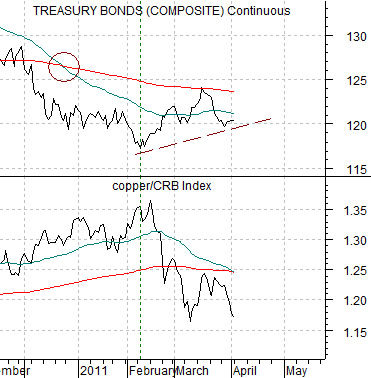
The chart just below compares the U.S. 30-year T-Bond futures with the ratio between copper and the CRB Index.
The first argument is that once copper began to weaken relative to the CRB Index in February (coinciding with the upward spike in crude oil prices) the bond market began to rise in price. Since the equity market had been rallying with falling bond prices the up turn for bonds led to a break in the SPX from 1350 down to 1250.
The second argument is that when the moving average lines for the TBond futures ‘cross’- as they did in December- there is usually a reflex rally for prices back towards the 200-day e.m.a. line. In other words… the decline in the copper/CRB Index ratio is consistent with a temporary pause in an ongoing trend as it allows the TBonds the chance to correct the downward excesses by floating back up to the moving average line before swinging lower once again.
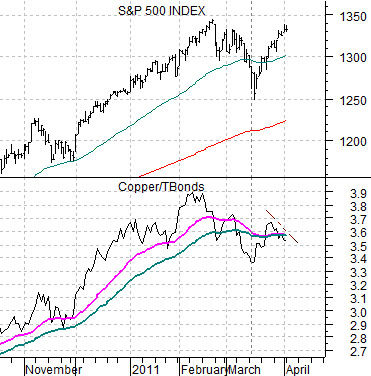
Below is a comparison between the S&P 500 Index (SPX) and the ratio between copper futures and the U.S. 30-year T-Bond futures.
The stock market has been following the copper/TBonds ratio so when copper prices are strong and bond prices are weak the ratio moves upwards along with the SPX. Problems tend to show up once the ratio begins to weaken as it did around the middle of February this year.
The point here is that the equity markets have shown a tendency to rise early in a new quarter in anticipation of corporate earnings releases but on those occasions when the copper/TBond ratio was diverging to the down side the SPX has eventually buckled. The longer the copper/TBond ratio declines the more likely we are to see a return to SPX 1250 or even 1200 later in the month.
In a perfect world copper prices swing higher as energy prices weaken along with long-term bond prices. A more bearish outcome would appear likely if copper prices remain weaker in the face of rising energy and bond prices through into the second half of this month.
Equity/Bond Markets
The question that we were asked yesterday was how high crude oil prices would have to rise before the equity markets would collapse. The writer suggested that crude oil futures appeared ready to challenge the 200 level.
Our thoughts were that equity markets would buckle long before crude oil prices got anywhere close to 200 and that it seemed quite unlikely that crude oil prices could get anywhere near that level at this time.
The caveat here is that if copper prices rose well above 6.00 in the interim with the SPX rising to at least 1600 then maybe… crude oil futures prices could touch 200.
So let’s explain the numbers mentioned above.
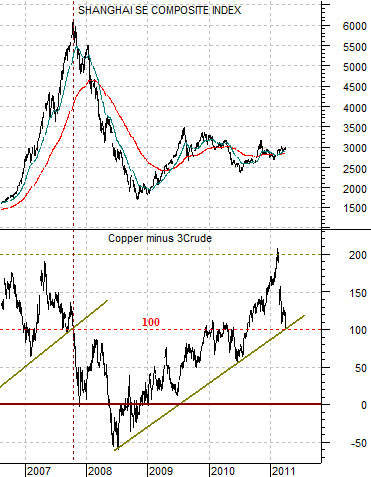
Below is a chart of the Shanghai Composite Index and the spread or difference between copper futures (in cents) and 3 times crude oil futures (in dollars).
The argument is that over time copper in cents will tend to equal out to 3 times the price of crude oil in dollars. In other words the initial rise above 4.00 (400) for copper in 2006 suggested that in due course crude oil could rise above 133 (3 times 133 equals 399). Crude oil eventually touched 147.
As long as copper is rising faster than crude oil (i.e. the spread line is trending higher) the cyclical trend will tend to be positive. We have suggested in recent issues that if the spread declines below 100 then the trend may be set to turn bearish in the same way that it did in the autumn of 2007.
Now… the peak for copper so far has been around 4.60 so the argument would be that in due course crude oil could rise back towards 153 (153 times 3 equals 459).
If copper prices were to rise to 6.00 then the projected peak for crude oil would be 200.
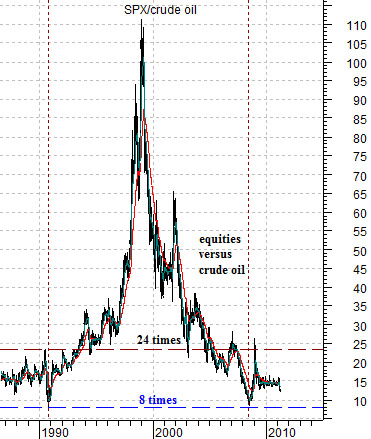
Next is a chart of the S&P 500 Index (SPX) divided by crude oil futures.
The two major peaks for crude oil over the past 20 or so years have been made when the ratio between the SPX and crude oil declined to roughly 8 times. In both instances the ratio quickly snapped back up to around 24 times.
The point is that while this time could be different… history suggests that the bottom for this ratio should be at or above 8 times.
What does this mean? We could see 200 for crude if the SPX were at or above 1600. If the index held at, say, 1300 then crude oil prices would have a hard time rising beyond 162. If on the way to 162 oil price strength collapsed the stock market then the ratio suggests that crude oil simply wouldn’t make it to 162 (at SPX 1200 a ratio of 8:1 argues for crude oil peaking at 150).
The point? We can’t dismiss the possibility of a rally to 150 for crude oil but something close to 200 might take a couple of years and much higher copper and equity prices in the mean time. Even then… the SPX/crude oil ratio has tended to triple almost immediately after testing the 8:1 region.