We are going to continue to focus on the two potential outcomes suggested by the 9-month decline in crude oil futures prices relative to the CRB Index. In yesterday’s issue we showed that a return to energy price strength early in 2011 could take crude oil eventually to new price highs. That is certainly a distinct possibility. On the other hand… we can also make a fairly compelling case for an entirely different resolution.
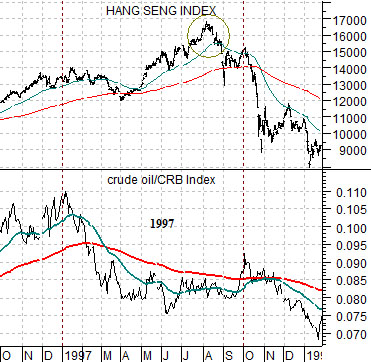
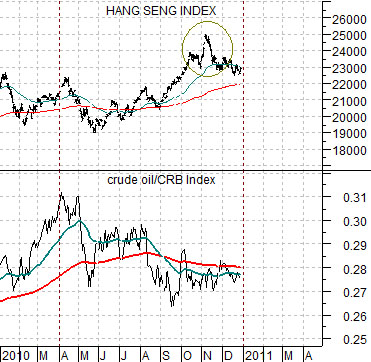
Our comparison is based on the way the markets behaved way back in 1997. At top right is a chart of the Hang Seng Index from Hong Kong and the ratio between crude oil and the CRB Index.
The argument once again is that divergences tend to run for about 3 calendar quarters. We know of no particular reason why this has to be so but since the markets have been kind enough to repeat this behavior we are going to use it for our work.
In January of 1997 the crude oil/CRB Index ratio peaked and turned lower even as the Hang Seng Index pushed to new highs through the summer months. Nine months after the top for the crude oil/CRB Index ratio the Hang Seng Index collapsed. Notice on the chart that the final upward surge in this index into the end of the third quarter coincided with a late burst of energy price strength.
Below is a chart of the same comparison from the current time period.
The chart shows that the crude oil/CRB Index reached a top around the end of this year’s first quarter so as we approach the end of 2010 the divergence has run for roughly nine months.
In a manner very similar to 1997 the Hang Seng Index made a price top in early November (lining up nicely with the peak in August of 1997) before turning somewhat lower.
Based on this comparison it is altogether possible that one of the key trends early in 2011 will be price weakness in the Asian equity markets. This would go with downward pressure on energy prices as investors face the prospect of slower Asian growth in response to repeated attempts by countries such as China to head off speculative increases in asset prices. Our point is that the trend for commodity prices in general and energy prices in particular during 2011 will likely be a function of the trends emanating out of the Asian equity markets.
Equity/Bond Markets
We have argued over the years that the trend for the commodity markets is essentially the same trend as the Hang Seng Index. Our focus of late has been on the declining trend for the crude oil/CRB Index ratio and the two fairly obvious ways that it may resolve early in 2011 (i.e. higher in response to strength in the Hang Seng Index or lower as a result of weakness in this market).
However… if we use 1997 as our template then it makes sense to look at a number of sectors that did quite well during 1997 and into 1998.
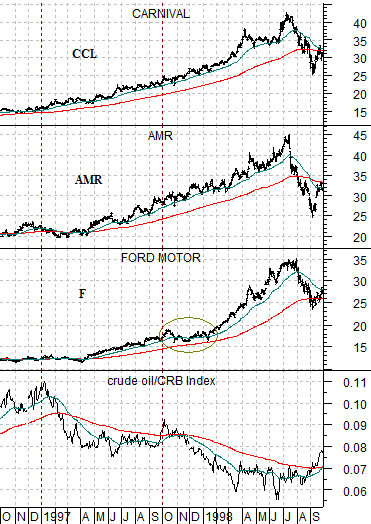
Below is a chart comparison between Carnival (CCL), AMR, Ford (F), and the crude oil/CRB Index from the autumn of 1996 into the autumn of 1998.
What we are looking at or for are sectors that actually rose in response to downward pressure in crude oil and Asian growth during 1997 and 1998.
The first point is that, by and large, most sectors came under some kind of pressure when the Hang Seng Index ‘crashed’ in the final quarter of 1997. The S&P 500 Index started the quarter around 955, rose quickly to 980 over the first week, and actually touched 855 on an intraday basis towards the end of October before reversing to close around 922. It took the index close to 4 months to move back above 980 and by the end of the first quarter of 1998 it had moved nicely above 1100.
The second point is that the offset to weakness in energy prices (i.e. a falling crude oil/CRB Index) was strength in the share prices of the energy ‘users’. In general 1997 and 1998 were heady days indeed for cruise ship operator Carnival, airline AMR, and auto maker Ford.
Our view is that the trend may resolve early in 2011 towards energy price strength if the Hang Seng Index begins to surge higher or energy price weakness if the index continues to decline. If the latter proves to be true then the broad U.S. stock market will come under pressure until the Hang Seng Index finds some kind of support but it will make sense to focus our attention on the energy ‘user’ sectors for the next few quarters.
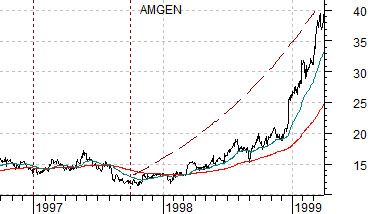
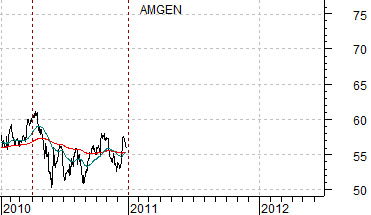
Further below are two charts of the share price of biotech giant Amgen (AMGN). The top chart is from 1996 into 1999 while the lower chart is from the current time period.
In 1997 the share price of Amgen was under pressure until the end of the third quarter. In other words the ‘pivot’ point for AMGN occurred as the Hang Seng Index crumbled.
Amgen moved slowly higher through the first half of 1998 and then shifted into a parabolic rise into 1999.
We tend to associate strength in Amgen with concurrent strength in the U.S. dollar. The argument would be that a break in the Asian equity markets would lead to a return to dollar strength (which likely makes reasonable sense) and a shift towards sectors like biotech and away from the Asian, Latin, and emerging markets themes.