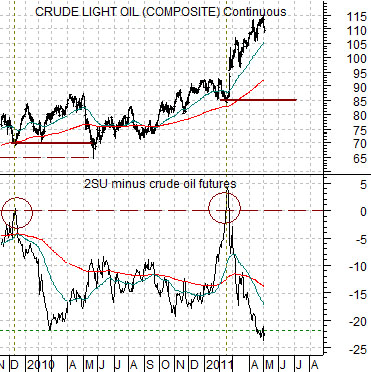
Let’s get right to it today. We continue to look for crude oil futures prices to resolve back down to around the 85 level.
Below is a comparison between crude oil futures and 2 times the price of Suncor (SU) minus the price of crude oil. The argument is that SU tends to trade around one half of the price of crude so when SU starts to decline it usually means that oil prices are going to head lower. In late 2009 the price of oil rose as the spread fell from 0 to less than -20 with oil prices eventually breaking back to the original starting point. A repeat of this relationship would pull oil prices back to roughly 85 in due course.
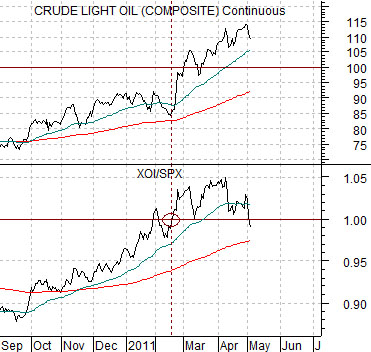
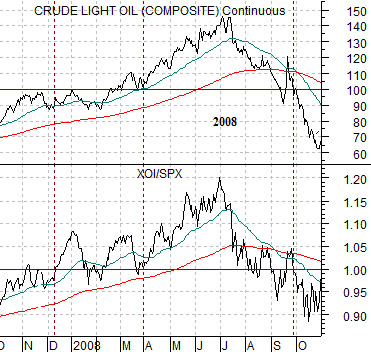
Next and further below are chart of crude oil and the ratio between the Amex Oil Index (XOI) and S&P 500 Index (SPX). The argument is that when the XOI/SPX ratio rises above 1:1 we should expect to see crude oil futures prices north of 100.
Yesterday the ratio dipped back below 1:1 for the first time since February. The relationship could still be volatile but as long as the ratio is falling the idea is that crude oil futures prices are likely better somewhere back in double digits.
Equity/Bond Markets
How the markets react in the near term may depend upon how much ‘slack’ has been created by the recent surge in energy prices. In other words when oil prices are rising there is a negative impact on the share prices of companies that are heavy end ‘users’. The airlines are a good example of a sector that gets punished whenever oil prices get overly strong.
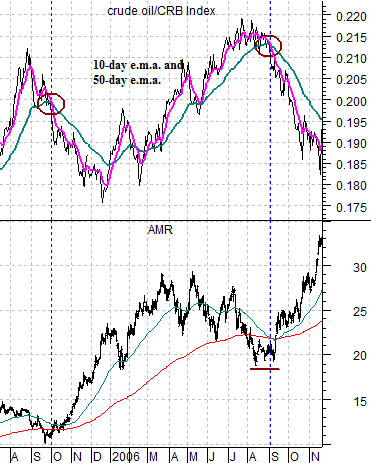
Just below is a chart of AMR and the ratio between crude oil and the CRB Index from 2005- 06.
In general AMR will tend to trade inversely to the crude oil/CRB Index ratio. The point, however, is not that AMR turned upwards as soon as oil prices started to weaken in 2005 and 2006 but rather that it took about a month for the stock to start to truly rally. Using two moving average lines we came up with the idea that it may take a ‘crossing’ of the 10-day e.m.a. down through the 50-day e.m.a. before we start to see some life from the airlines.
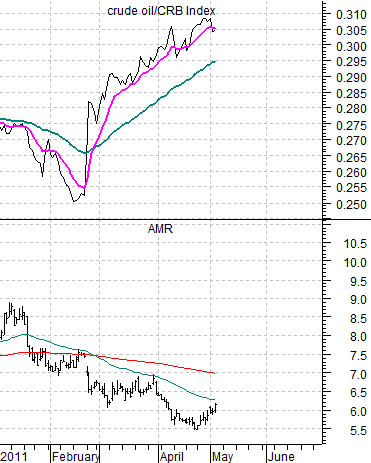
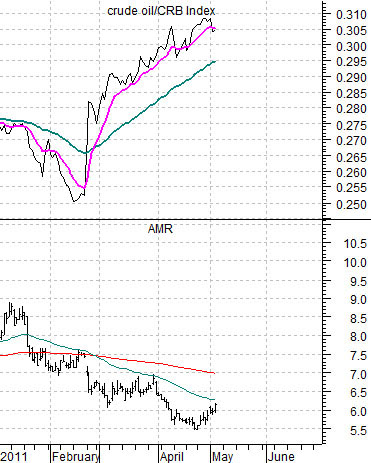
Next is the current situation. Notice that while AMR has been showing some strength over the past few sessions the ratio is still some distance above the 50-day e.m.a. line.
Shifting gears we turn to the charts shown below. We have taken a chart of Intel (INTC) and placed it over a chart of 10-year U.S. Treasury yields. The arguments are that Intel trends fairly closely with yields but… has a tendency to lead yields by about one month. The charts, by the way, have been offset or shifted by one month so that Intel in March is lined up with yields in April.
The argument here is that the weakness in yields into May is a function of the weakness for Intel into April. If the relationship persists then we would expect to see near-term weakness for yields turning into a rising trend later this month.