May 20 (Bloomberg) — China’s economic recovery began to stall in the second half of April and is slowing further this month, raising concern that the rebound won’t be as “strong as many recently have hoped,” Credit Suisse Group AG said.
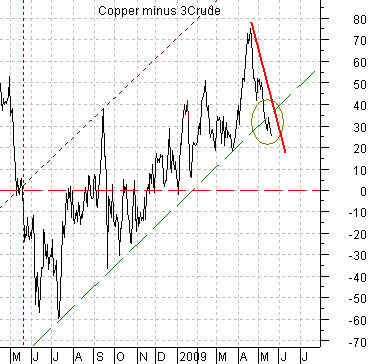
The chartbelow shows the spread between copper and crude oil prices with copper in cents and crude oil in dollars (multiplied by three times). The argument is that when the spread line is rising (i.e. copper stronger than crude oil) it reflects positive Asian growth and when the spread line is declining the equity markets tend to favor some of the more defensive growth names (like Wal Mart).
By now everyone is likely aware that the cyclical recovery in asset prices has been led or driven by the perception of growth in China. The chart, however, concurs with Credit Suisse’s assertion that China’s economy may have started to slow last month as the spread line turned somewhat lower.
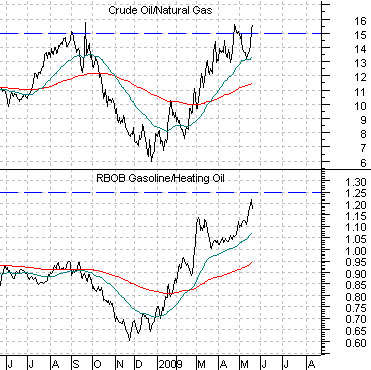
Below we feature a comparison between two energy-related ratios. The chart includes the ratio of crude oil futures prices to natural gas futures prices as well as the ratio between gasoline futures and heating oil futures.
We have argued from time to time that energy prices have a seasonal trend. From roughly December into May gasoline futures tend to rise relative to heating oil while from August through into December heating oil prices tend to be stronger. The summer driving season in the U.S. officially starts at the Memorial Day weekend but this also tends to mark the high point for gasoline prices on a relative basis.
At present the ratio between gasoline and heating oil is close to levels associated with rather glaring historical peaks. The same is true for the ratio between crude oil and natural gas prices. In fact crude oil is now a high relative to natural gas as it was at the cycle peak made during the third quarter of last year.
Our point is that the rising trend for energy prices has been driven by gasoline futures but by later this month the trend is going to become more sensitive to heating oil and natural gas. To the extent that it is possible this summer to actually run out of physical storage in the U.S. for natural gas a very good case can be made for yet another negative energy price trend through the second half of this year.
Equity/Bond Markets
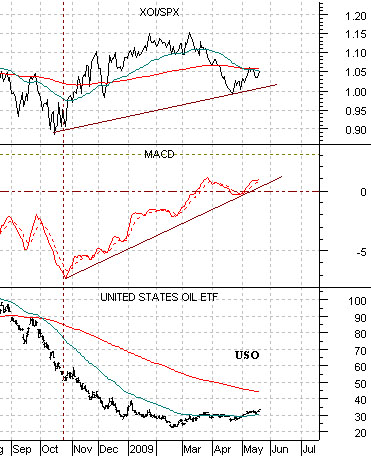
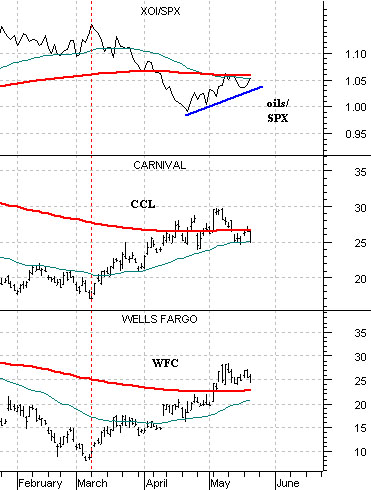
Belowwe show the crude oil etf (USO), a MACD indicator for the USO, and the ratio between the oils (XOI) and S&P 500 Index (SPX).
The markets seem to like second or third derivative indicators. In other words when the rate of change of the rate of change begins to improve many take that as an indication of ‘green shoots’. Fair enough.
The quick point is that the MACD for the USO turned positive just ahead of the Chinese stock market which, in turn, swung higher just in front of copper prices which, in turn, led the recovery in most major equity markets. The problem is that the MACD is also trending with the XOI/SPX ratio and this ratio- shown below right- needs to break to the down side if WFC and CCL are ever going to kick up through their moving average lines on a sustained basis. What we are looking for (and have been for months now) is a second decline in crude oil prices that turns the MACD for the USO back to the down side.
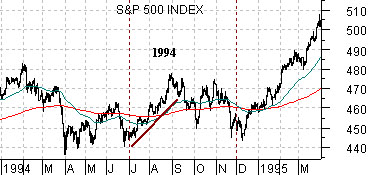
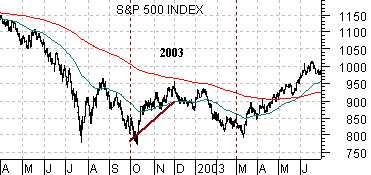
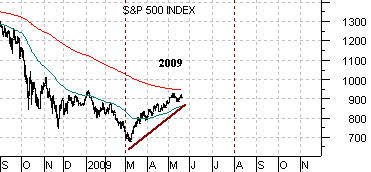
Below we have included three charts of the S&P 500 Index. The top chart is from 1994, the middle chart from 2002- 2003, and the lower chart from the current time period.
Our thesis is that similar to 1994 and 2002- 2003 the SPX is in the middle of a 5-month ‘pattern’ that includes a couple of months of higher prices followed by a two or three months of consolidation. Our oft-repeated argument is that we are looking for a better entry point back to the long side in August.