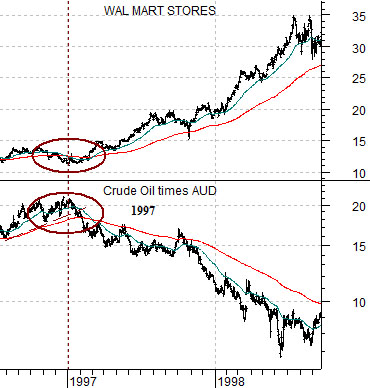
Our two favorite defensive stocks are Wal Mart (WMT) and Nippon Tel (NTT). NTT is more of a surrogate for bond prices and the Japanese yen while WMT- in our view- tends to trend inversely to the Asian/commodity/BRIC themes that have recently captured the hearts and minds of investors.
Immediately below we show a chart comparison between Wal Mart and the combination of crude oil futures times the Australian dollar (AUD) futures from 1996 into late 1998.
Why crude oil times the Aussie dollar? Mainly because the basic trend for commodity prices and the trend for the commodity currencies are almost identical. Why not the Cdn dollar? No particular reason actually. The Aussie dollar tends to be stronger than the Canadian dollar when the Asian growth theme is positive. The combination of crude oil times the Aussie dollar captures the trends for energy prices and the flow of money towards commodity-based and Asian growth themes.
In any event… the point is that when the cyclical theme turned negative at the start of 1997 it was offset by a positive trend for Wal Mart. Through 1997 and 1998 as money moved away from Asian- ultimately creating 1998’s Asian crisis- the share price of Wal Mart moved higher.
The thought is that as long as Wal Mart is wallowing below its moving average lines it is likely that any weakness in the commodity or Asian equity markets will be short lived. To truly mark the start of another downward slide in cyclical growth our expectation is that the markets are going to have to apply the paddles to WMT to kick it back to life.
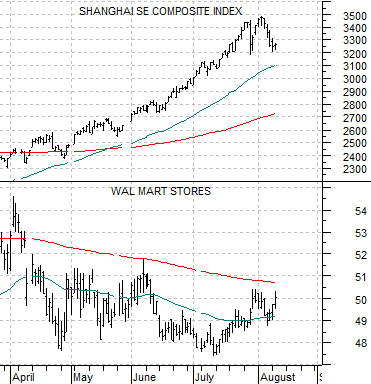
Below we compare the Shanghai Composite Index with the share price of WMT.
The last period of price strength for WMT began in the autumn of 2007 as the Shanghai Comp. peaked and began to decline. Since copper, crude oil, emerging markets, and Asian equities are part of the same theme with the U.S. dollar, yen, and bond market on the other side the argument is that strength in WMT following this week’s earnings report would heighten the seriousness surrounding the very recent chopping action in the Shanghai Comp. In other words… the stronger WMT is coming out of August the better the odds that the Shanghai Comp. is making a top.
Equity/Bond Markets
Today’s argument revolves around the rather curious tendency of the share price of Amgen (AMGN) to turn higher around 8 months ahead of the broad equity market (S&P 500 Index).
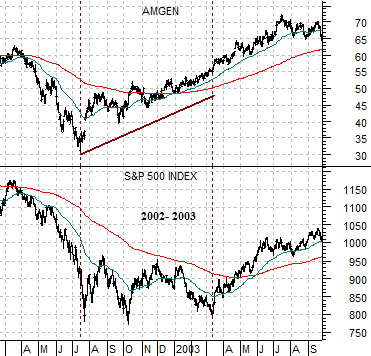
The first chart below compares AMGN with the SPX from 2002- 2003. We could have used the 1990 times frame or even 1994 but this should suffice. The idea is that eight months before the SPX began to rally in March of 2003 the share price of AMGN started to trend upwards.
Below are charts of Amgen and the S&P 500 Index from the current time frame. The twist is that the charts have been shifted or offset by eight months. With this little ‘adjustment’ the start of a rising trend for AMGN in June of 2008 is lined up with the recovery for the broad market in March of 2009.
We have made this point once or twice in previous issues but the thesis is that if AMGN had simply risen from the mid-2008 lows then the March bottom for the SPX would represent THE stock market bottom. The issue, in other words, would be simple and clear cut.
The problem is that AMGN made a second bottom into April of this year which, according to our thesis, suggests that there should be downward pressure on the equity markets for the balance of the year. The next cyclical recovery would begin in January as the markets swing back to the ‘strong energy and metals’ theme that has tended to dominate through the first six months of the year.
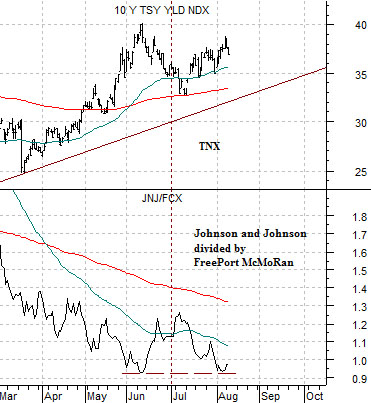
Below we compare 10-year Treasury yields (TNX) with the ratio between Johnson and Johnson (JNJ) and FreePort McMoRan (FCX).
IF yields have peaked THEN the JNJ/FCX ratio should have bottomed. Obviously the issue has not been clearly decided but for the time being we can at least argue that the markets have not proved us wrong- yet.