Oct. 6 (Bloomberg) — The Bank of Japan may have acted first in a new round of central bank action to prop up the global economy as recoveries in industrial nations falter.
The unexpected decision by the Japanese central bank yesterday to drop its interest rate to “virtually zero” and expand its balance sheet follows the U.S. Federal Reserve’s move toward more unconventional easing. Bank of England officials will consider further stimulus tomorrow, while the central banks of Australia, Canada and New Zealand are among those now holding fire on further interest-rate increases.
Our view has been that the cyclical trend will remain stronger through the final quarter of this year with the debt to the piper due to be paid early in 2011. We have commented that the initial crack in the rising trend will likely come from a return to dollar strength.
Our point is that we are confirmed cyclical ‘bulls’ in the short run even though we have concerns about the trend starting early next year. On the other side of the coin a case can be made for a much longer rally so in response to yesterday’s price gains we thought we would make an attempt to show this perspective.
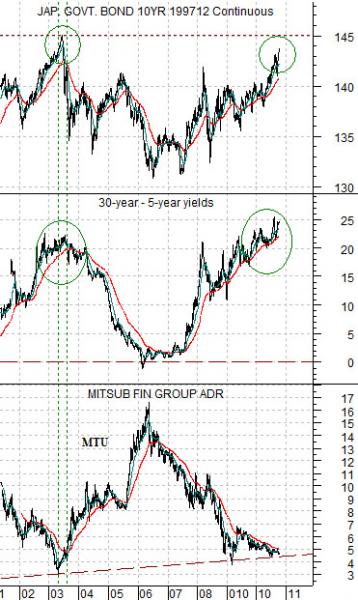
Below is a chart comparison between 10-year Japanese bond (JGB) futures, the yield spread between U.S. 30-year and 5-year Treasuries, and the share price of Japanese bank Mitsubishi UFJ (MTU).
The argument has been that MTU began to lift in 2003 when two things happened within the bond market. First, the Japanese bond futures finally reached a price peak. Second, the spread between 30-year and 5-year yields topped out and started to decline.
With the JGBs moving back up to peak levels last seen in 2003 and the yield spread very close to a what appears to be a ‘top’ the chart-based argument is that the share price of MTU could or should be near a low.
Once the trend for MTU turns positive (if, as, or when) then it should remain that way until the yield curve eventually flattens out as 30-year yields return to close to the same level as 5-year yields. It took from 2003 into the spring of 2006 (a time period much longer than a single calendar quarter) to accomplish this feat in the prior decade which means that if the Japanese bond futures decline in price in response to additional central bank easing… we could be in the very early stages of a lengthy price rally.
Equity/Bond Markets
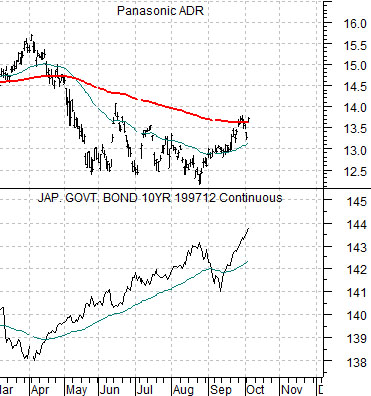
Below is a comparison between the JGB futures and the share price of Panasonic (PC).
The ongoing argument has been that even if the price of the JGBs continues to rise towards 2003’s highs of 145… if the share price of PC breaks cleanly up through the 200-day e.m.a. line the underlying trend for bond prices should be negative. This led to a virtual ‘crash’ in the Japanese bond market through the third quarter of 2003.
The point is that PC has recently been stronger but has yet to ‘break clear’ of the moving average line.
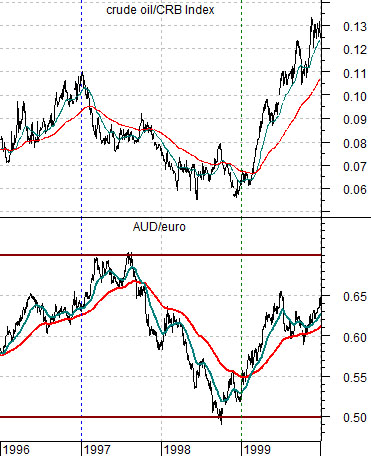
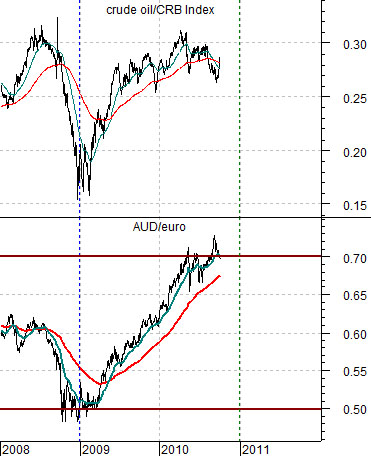
Further below are two charts of the cross rate between the Aussie dollar and euro (AUD/euro) as well as the ratio between crude oil and the CRB Index. The top chart focuses on the time frame between 1997 and 1998 while the lower chart is from the current time period.
In a sense the trend during 2009 and 2010 is the opposite of the trend that dominated the markets from 1997 through 1998. By ‘opposite’ we mean that there was a two year time period running from 1997 through 1998 that witnessed a very strong push by capital away from the Aussie dollar towards the euro while the trend from early 2009 to the present has featured a very strong push by capital away from the euro towards the Aussie dollar.
A strong AUD/euro goes with relative price strength for crude oil. A weak AUD/euro goes with relative weakness for energy prices.
Our point here is that one of the risks to the strong cyclical trend that has pushed asset prices since the end of 2008 is… a significant crack in the rising AUD/euro cross rate. Notice that when the cross rate rose up through the 200-day e.m.a. line around the end of 1998 the bear market for energy (and metals) prices had come to an end. IF the AUD/euro were to break DOWN through the moving average line some time over the next few months THEN we will conclude that the cyclical recovery has come to an end.