If we argue in favor of U.S. dollar strength we are, in fact, suggesting that other currencies will be weaker. In other words the dollar doesn’t have to be strong as long as the currencies that it is priced against are declining.
March 18 (Bloomberg) — The euro weakened for a second day against the dollar and yen in the longest stretches of decline in almost a month on concern Greece will fail to secure financial assistance from the European Union.
March 18 (Bloomberg) — Brazil interest-rate futures sank the most in nine months and the real fell after central bank President Henrique Meirelles held off raising borrowing costs ahead of his decision on whether to run for elected office.
March 18 (Bloomberg) — Asian currencies retreated from a 19-month high, led by South Korea’s won and the Taiwan dollar, on speculation central banks will seek to limit appreciation that may hurt exports.
March 18 (Bloomberg) — Mexico’s peso fell from a 16-month high as Finance Minister Ernesto Cordero said that the government may increase the amount of dollars it buys in the foreign-exchange market.
We have shown in past issues that there has been a tendency in the past for ‘bubbles’ to start to crack in earnest some time around the month of March in the first year of a new decade. In other words… right about now. If the unwinding of capital of flows away from the dollar turns out to be the ‘bubble’ then we could see the dollar strengthen over the next few weeks.
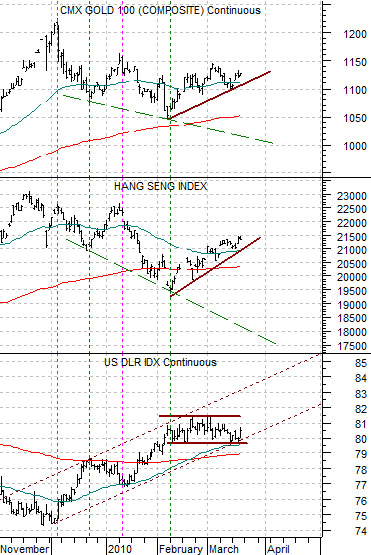
Below we compare gold futures, Hong Kong’s Hang Seng Index, and the U.S. Dollar Index (DXY) futures. The argument here is that each time the dollar reaches a bottom gold prices and the Hang Seng have risen to a top. Conversely when the dollar pushes to a high we find both gold and the Hang Seng at their lows. From the start of dollar strength last November to the present day the sequential highs for gold and the Hang Seng have been lower while the lows have also been lower.
The point? If the dollar continues to rise back to the top of its recent trading channel then a case can be made for a return to the 1000 level for gold and something in the vicinity of 18,000 for the Hang Seng Index.
Equity/Bond Markets
It is often hard to know whether strength in one market creates weakness in another or whether weakness in one market leads to strength in an offsetting sector. We do know that the health care and pharma themes can trend inversely to commodity prices at times so with the ongoing pressures created by President Obama’s health care reform this might be one of the better explanations for recent energy and base metals price strength.
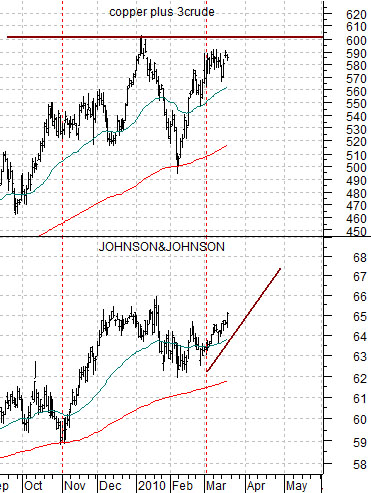
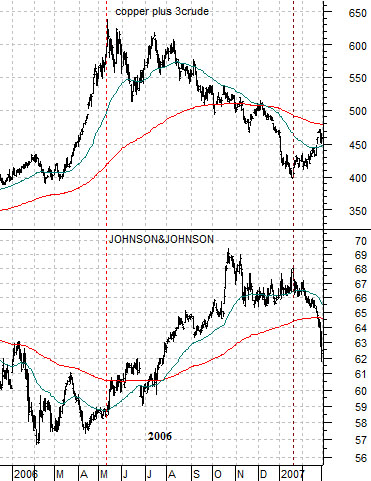
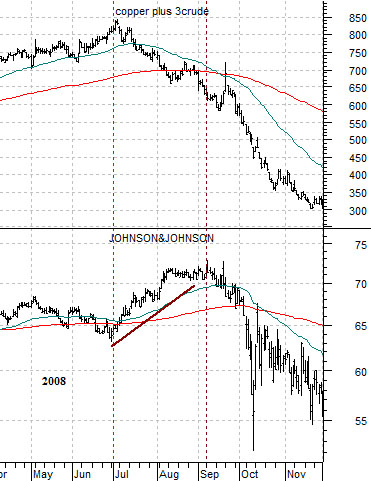
Below are two chart comparisons between the sum of copper and crude oil (copper in cents plus 3 times crude oil in dollars) and the share price of Johnson and Johnson (JNJ). The chart at top right is from 2006 while the chart below right comes from 2008.
A peak for copper and energy prices can lead to or go with a significant trend change within the markets. In 2006, for example, JNJ began to rise in price as soon as commodity prices started to weaken. In 2008 the share price of JNJ enjoyed a couple of months of strength following the peak for copper and crude oil but by September as Lehman’s ship began to sink the entire market collapsed taking equities and commodities lower.
While it was only ‘one day’ the sense we got yesterday was that the trend for JNJ was beginning to strengthen somewhat. The chart below shows that JNJ did take a run through November on dollar strength before correcting lower from December through February. Our thought is that if JNJ pushes on to new highs above 66 it will likely mean that we have reached some kind of intermediate-term top for commodity prices in response to renewed strength in the U.S. dollar.