Let’s get this out of the way first. Our expectation is that China’s construction boom is going to collapse as massive excess supply meets the reality of tighter credit. Our expectation is that raw materials prices are going to decline significantly along with long-term Treasury yields. Our expectation, however, is that this is not today’s problem. We are merely tossing it against the wall even though we believe that this is an issue for the final quarter of the year.
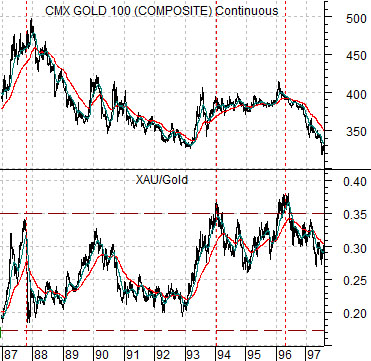
Below is a chart comparison between the price of gold futures and the ratio between the gold mining stocks (Philadelphia Gold and Silver Index- XAU) and gold prices from 1987 into 1997.
We selected this particular stretch of time simply because it will help us make a somewhat unrelated point. The argument is that peaks in the ratio between the gold miners and the price of gold have, on occasion, marked the highs for gold prices. Now… we will show on the following page that the opposite can also be true but for now we will rather simply state that a high for the price of a commodity can be associated with the peak for the ratio between the equities involved in the production of that commodity and the commodity itself.
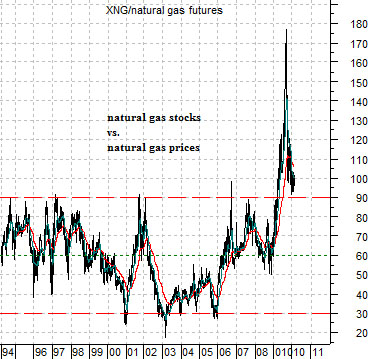
Next we have included a chart of the ratio between the Natural Gas Index (XNG) and natural gas futures.
From 1994 into 2009 the ratio between the XNG and natural gas futures ranged from around 30:1 up to 90:1. At present the XNG is trading just above 540 so based on this range the XNG is ‘saying’ that fair value for natural gas prices ranges from a low of around 6 (i.e. based on 90:1) and a high of close to 18 (based on 30:1).
The issue is that the equity markets have been trading in a manner that suggests that natural gas prices were going to resolve higher- which is, in point of fact, the way these things tend to work. The risk is that gas prices actually don’t rise. Why? Leverage.
By ‘leverage’ we mean that if the XNG does not push gas prices higher then gas prices may pull the XNG lower. If natural gas prices were to settle out at, say, 5 while the ratio declined back to 60:1 then the XNG would have fallen from around 540 back to 300. And that, we suspect, would leave a mark.


Equity/Bond Markets
Before we get too hysterical about the imminent prospect of a collapse in the value of shares involved in the production of natural gas we should take a moment and show the other side of the coin.
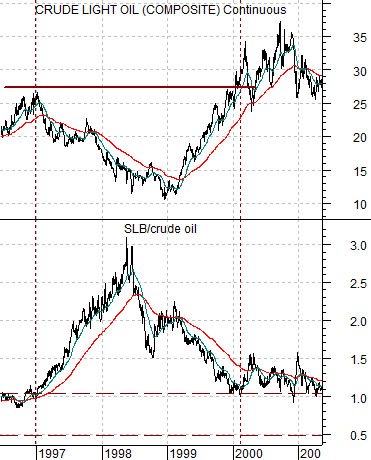
Below is a comparison between crude oil futures and the ratio between the share price of oil service giant Schlumberger (SLB) and crude oil futures.
We are using SLB to represent the broad concept of equities leveraged to oil prices. We are arguing that the SLB/crude oil ratio is similar to the XAU/gold and XNG/natural gas ratios shown on page 1.
The chart covers the time period between 1996 and 2001. Our focus is on what happened in between the peak for crude oil prices (and Asian growth) at the start of 1997 and the return to new highs for oil prices in 2000.
So… the chart shows that the weaker oil prices got during 1997 and 1998 the higher the ratio moved. At the start of 1997 SLB’s share price was very close to the price of crude oil (i.e. the ratio was around 1:1) and at the start of 2000 the ratio had returned to 1:1.
In this instance the equity markets were rather clearly ‘saying’ that the decline in oil prices was temporary. The share price of SLB remained strong even as oil prices collapsed which, we suppose, was the markets’ way of saying that prices would rebound.
As we watched the XNG/natural gas ratio skyrocket above the level (90:1) that had marked the upper extreme for the past 15 years our thought was that this meant that natural gas prices were as ‘low’ as the ratio was ‘high’. In other words as front month natural gas futures traded between 2.50 and 4.50 for much of 2009 the equity markets were ‘saying’ that this was a temporary event. Once the dust finally settled natural gas prices would return to a trading range between a low of around 6 and a high somewhere north of 10.
The twist is that all of this is mere preamble in front of the point that we wished to make today. The point is that we think the Canadian dollar is far too high. We are not going to suggest that it will decline today, next week, or even next quarter but our view is that the Canadian dollar is ‘fair value’ around .8000. When the commodity sector is in favor the currency will tend to push towards parity with the U.S. dollar and when the commodity sector is out of favor it will tend to move down towards .60.
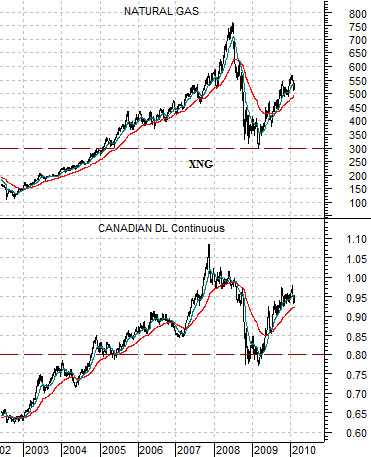
The last chart compares the Natural Gas Index (XNG) with the Canadian dollar (CAD) futures from 2002 to the present day.
If we believe that the CAD is ‘fair’ around .80 then the chart argues that the XNG will eventually resolve back towards 300. To get there all that would be required is the realization that 6 dollar natural gas will be the top end of the trading range instead of the bottom end. Put another way… all that would be required is an outcome similar to the XAU/gold that we showed on page 1.
Does this make sense? Almost 7% of Canada’s GDP is related to the production of natural gas. We will argue that there is a very close relationship between natural gas prices, the perception of the future for natural gas prices, and the Canadian dollar.


